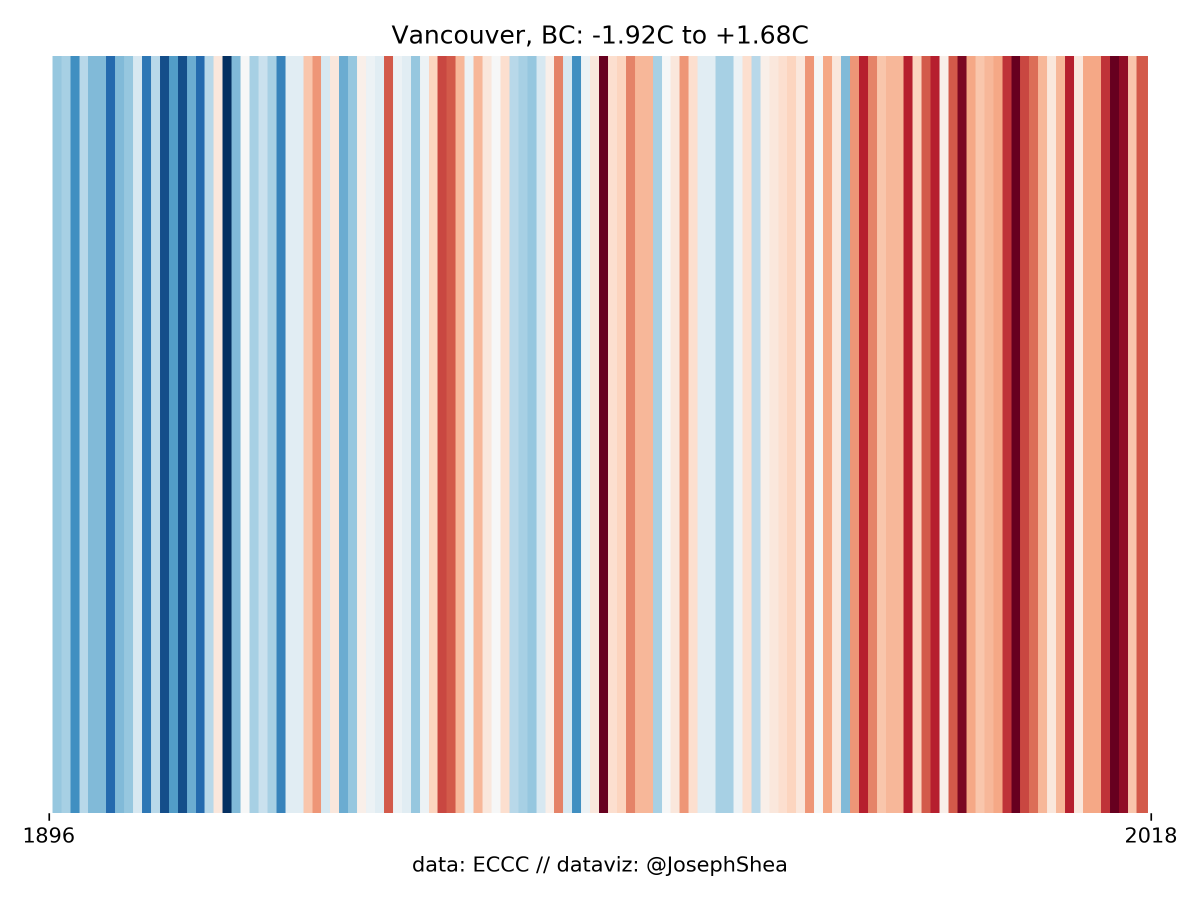
Today is the #SummerSolstice and #ShowYourStripes day, where people all over the world are thinking about #ClimateChange .
Here is a #ClimateStripes inspired animation.
Share your own climate stripes from showyourstripes.info


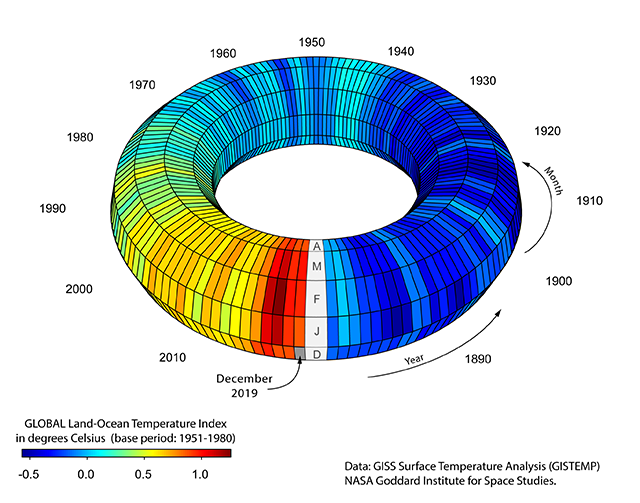
Inspired by Ed Hawkins #climatestripes I made a 3D climate donut 🍩😱
#ClimateChange #ShowYourStripes #ShowYourTorus #rstats #scicomm

#ClimateStripes -kaulahuivi tuli valmiiksi! Kaulahuivi kuvaa keskilämpötilaa viimeisen 170-vuoden ajalta. Näyttää tosi kivalta, mutta lankojen päättely oli hirveetä kun väri vaihtu niin usein.
Arvaattekos muuten kumpi pääty huivista on 1850-luku ja kumpi 2010-luku?


The #FIFAWorldCup 2022 starts tomorrow. How has Qatar's climate changed since since the inaugural edition of the tournament in 1930? #climatestripes
#ShowYourStripes Ed Hawkins


The amazing Ed Hawkins is taking his #ClimateStripes global with the launch of ShowYourStripes.info a site with simple graphics showing the history #ClimateChange in many countries and US states.
Data from Berkeley Earth, NOAA, UK Met Office, and others.
#ShowYourStripes


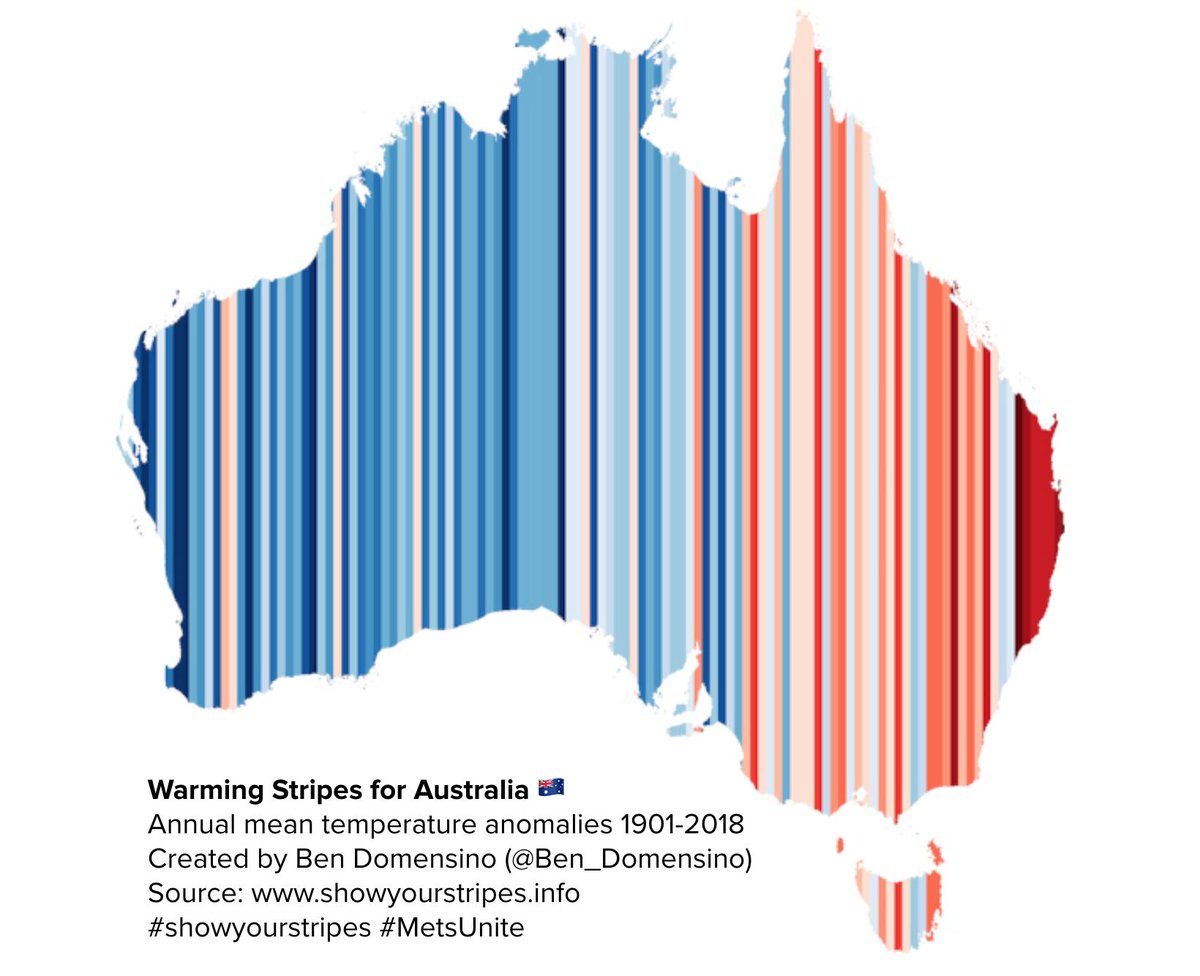
Australia's climate has warmed by just over 1°C since 1910. This map shows how our country's annual average temperature anomaly has changed over time using Ed Hawkins #climatestripes
More details and other countries at: showyourstripes.info
#MetsUnite
#showyourstripes

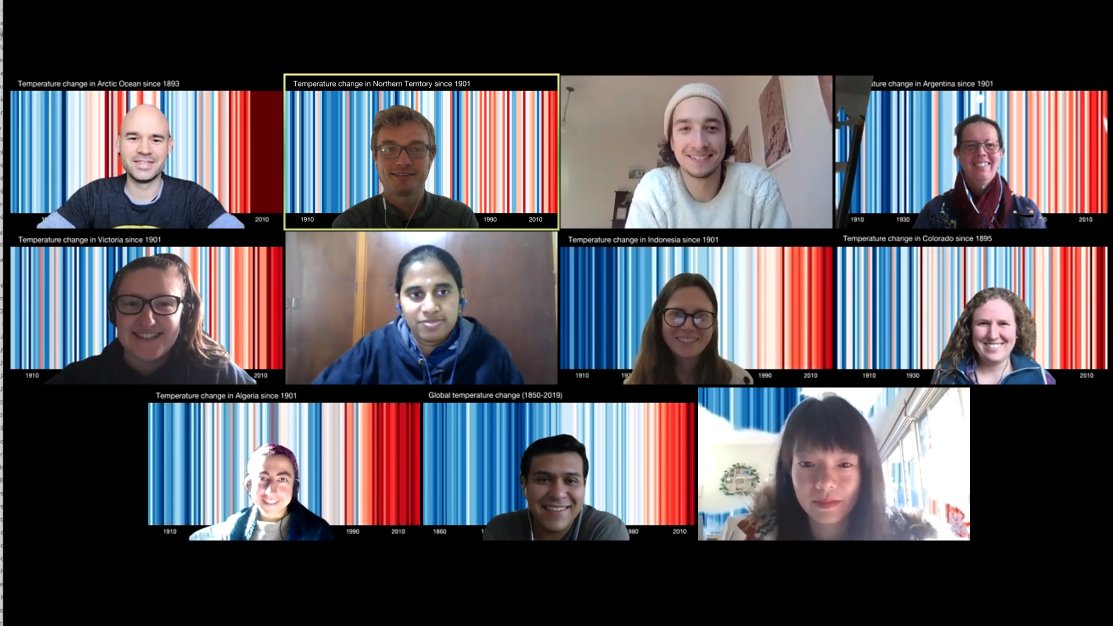
Happy Climate Scientists Day from @unimelb node of ARC Centre of Excellence for Climate Extremes showing our #climatestripes from a variety of regions thanks to Ed Hawkins and showyourstripes.info Firstdog Onthemoon Definitely no hugging today!

5.3 million years of natural climate change expressed in the style of Ed Hawkins 's #climatestripes .
For the real paleoclimate geeks, this is the Lisiecki and Raymo (2005) (aka LR04) benthic oxygen isotope stack.


Behold: Tom Di Liberto's and my new shower tiling, based on Ed Hawkins #ClimateStripes (global version where each tile is a country and year). #ShowYourStripes bbc.com/news/science-e…


An oak sadly fell in #Reigate Priory Park last week. We counted rings, measured girth and height and found that in 150 years it sequestered 10 tonnes of CO2 which is now being slowly released into air and soil. It lived through a 1C temp rise..1/3 #climatestripes © Ed Hawkins


12 days late, but I finally made 11x3 #ClimateStripes for all 50 states, DC and CONUS.
Enjoy y'all
ncics.org/pub/jared/stri…
#ShowYourStripes


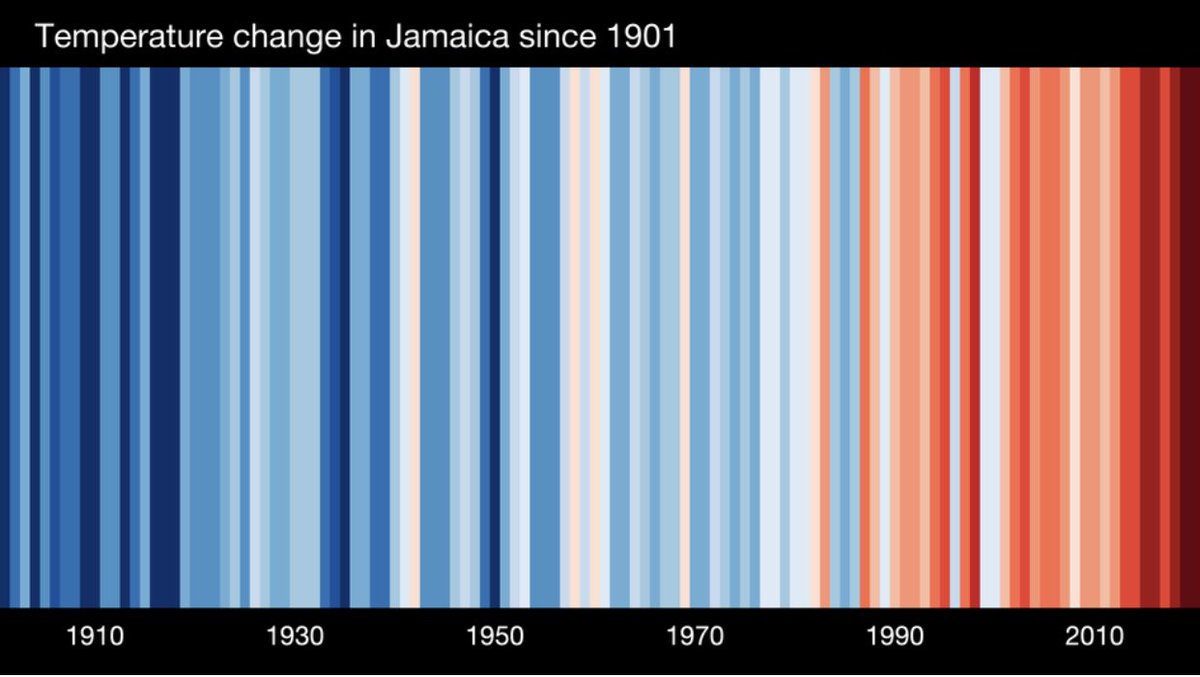
This is Jamaica’s “climate stripes” from 1900-2020. In essence it’s a relative heat map. Much to do, not a lot of time to do it.
#ClimateStripes


Throwback to when I pointed out the fraudulent modelling at the Met Office for their #climatestripes data. As a result they deleted the graphic from existence...whilst continuing their propaganda. Pathetic. Climate Realists🌞 peikko763🇫🇮 @dbirch214 Piers Corbyn

67 million years of natural climate change, in the style of Ed Hawkins #climatestripes (the so-called 'Zachos curve').
The warmest parts are about 50 million years ago, and had a carbon dioxide level similar to those we may experience ourselves if emissions continue unabated...


An amazing Tuesday receiving my OBE from King Charles III. I could never have dreamt that this would happen to me. Thanks to all my family, friends, Met Office, IPCC and colleagues for their support along the way. Thanks to Atelier Tammam for #climatestripes dress


Looking for #climatestripes for #FridaysForFuture events in #Canada ?
These plots show avg annual temperature anomalies (or departures from the mean) for Canadian cities. Blue = cold, red = hot, range of anomalies given in the title. #climatechange
1/n: Vancouver
