Carroll Doherty(@CarrollDoherty) 's Twitter Profileg
Carroll Doherty

@CarrollDoherty

Director of Political Research,
Pew Research Center
Public opinion, political data, ex-journo

ID:116775999

linkhttp://www.pewresearch.org/ calendar_today23-02-2010 14:54:45

12,3K Tweets

8,5K Followers

10,0K Following

Bolts(@boltsmag) 's Twitter Profile Photo

Election data is vital to voting rights. So why is it so hard to track down? boltsmag.org/election-data-…

account_circle
Andrea Mitchell(@mitchellreports) 's Twitter Profile Photo

Great pairing: two brilliant thinkers talk about Sanger's brilliant new book as Iran and Israel square off and Putin threatens Ukraine - and more

account_circle
Mike Abramowitz(@abramowitz) 's Twitter Profile Photo

Here is my big news. I am excited about leading @VOA, whose mission is so critical in the defense of journalism, free expression and truth. I am sad to leave Freedom House, but it will continue to prosper because it will always be a bulwark in defense of freedom and democracy.

account_circle
Carroll Doherty(@CarrollDoherty) 's Twitter Profile Photo

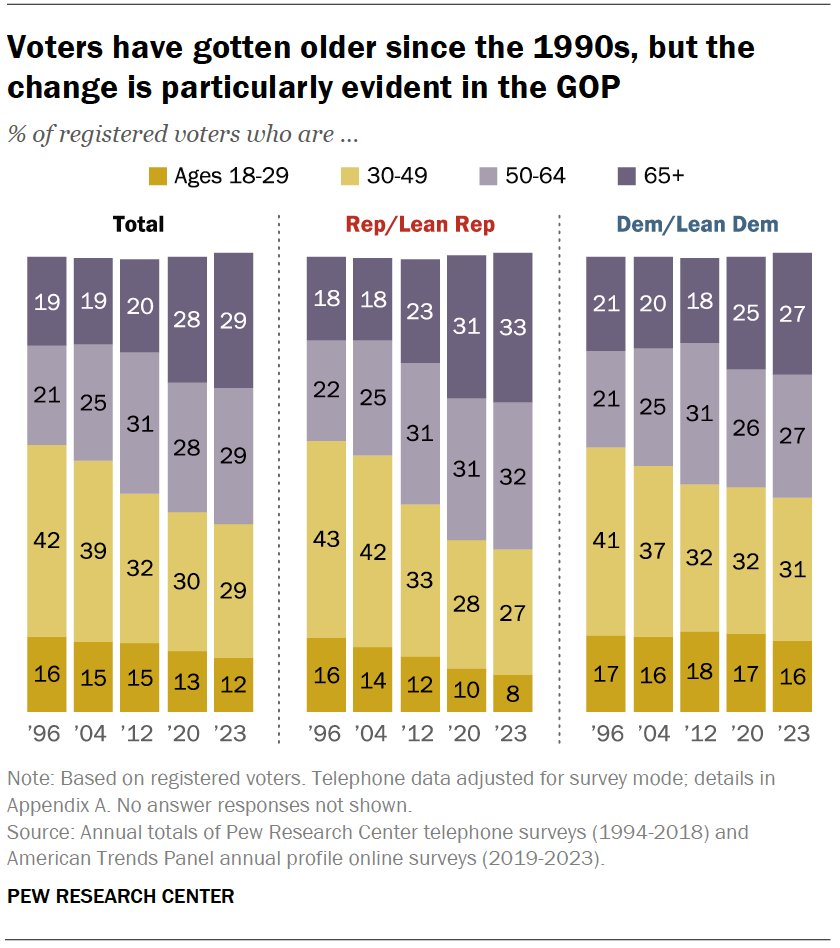
The electorate has gotten older since the 1990s: 58% of registered voters are 50 or older; that compares to 41% in 1996. And older voters vote at higher rates, so they have even more electoral clout.
pewrsr.ch/49v1YPB

The electorate has gotten older since the 1990s: 58% of registered voters are 50 or older; that compares to 41% in 1996. And older voters vote at higher rates, so they have even more electoral clout. pewrsr.ch/49v1YPB
account_circle
Pew Research Center(@pewresearch) 's Twitter Profile Photo

As in past years, Americans view their state and local governments far more positively than the federal government in Washington. But favorability ratings of all three levels of government have taken a downturn from a few years ago.

As in past years, Americans view their state and local governments far more positively than the federal government in Washington. But favorability ratings of all three levels of government have taken a downturn from a few years ago.
account_circle
Mileah Kromer(@MileahKromer) 's Twitter Profile Photo

Appreciate it, but credit to the good folks at Pew Research Center. They have spent considerable resources on education—and I am so thankful for their work.

account_circle
Carroll Doherty(@CarrollDoherty) 's Twitter Profile Photo

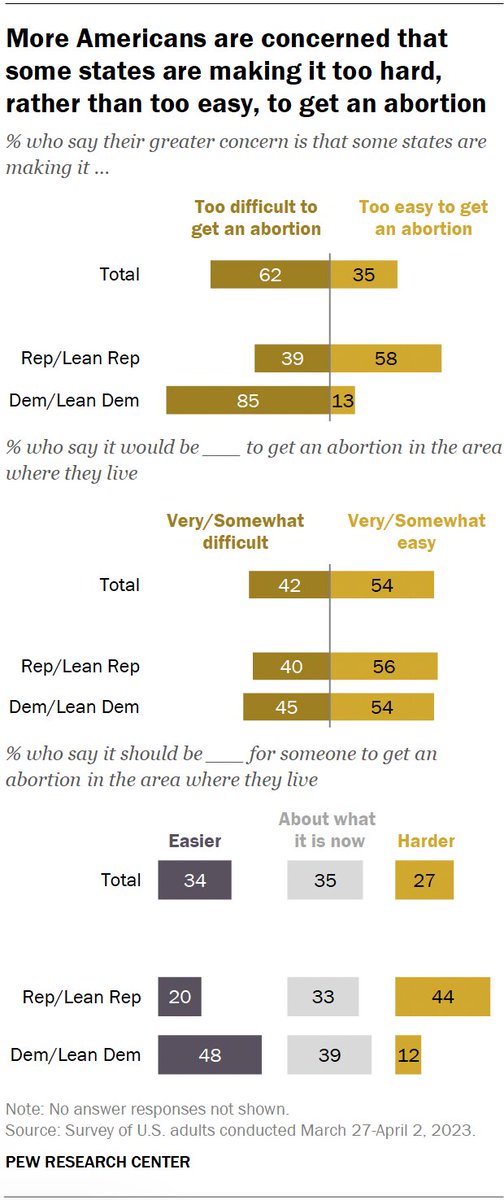
On the states and abortion, this from last year: 62% of US adults (including 39% of Republicans and GOP leaners) said their greater concern was that some states are making it too hard, rather than too easy, to get an abortion.
pewrsr.ch/3oK4qQK

On the states and abortion, this from last year: 62% of US adults (including 39% of Republicans and GOP leaners) said their greater concern was that some states are making it too hard, rather than too easy, to get an abortion. pewrsr.ch/3oK4qQK
account_circle
Natalie Jackson(@nataliemj10) 's Twitter Profile Photo

For more on why I'm a skeptic about declaring political realignments based on poll subgroups, here's a wonky piece on how weighting affects *everything*. Polling has become more art than science these days.

My latest National Journal (unlocked)

nationaljournal.com/s/724711/can-p…

account_circle
Christine Zhang(@christinezhang) 's Twitter Profile Photo

a great write-up by Ruth Igielnik of the latest Pew report on party ID in the U.S. In 2020, Ds outnumbered Rs (including leaners)

now, Ds & Rs are evenly divided, due in part to increasing R gains among voters without a college degree

nyti.ms/3xphuiC

a great write-up by @RuthIgielnik of the latest Pew report on party ID in the U.S. In 2020, Ds outnumbered Rs (including leaners) now, Ds & Rs are evenly divided, due in part to increasing R gains among voters without a college degree nyti.ms/3xphuiC
account_circle
Carroll Doherty(@CarrollDoherty) 's Twitter Profile Photo

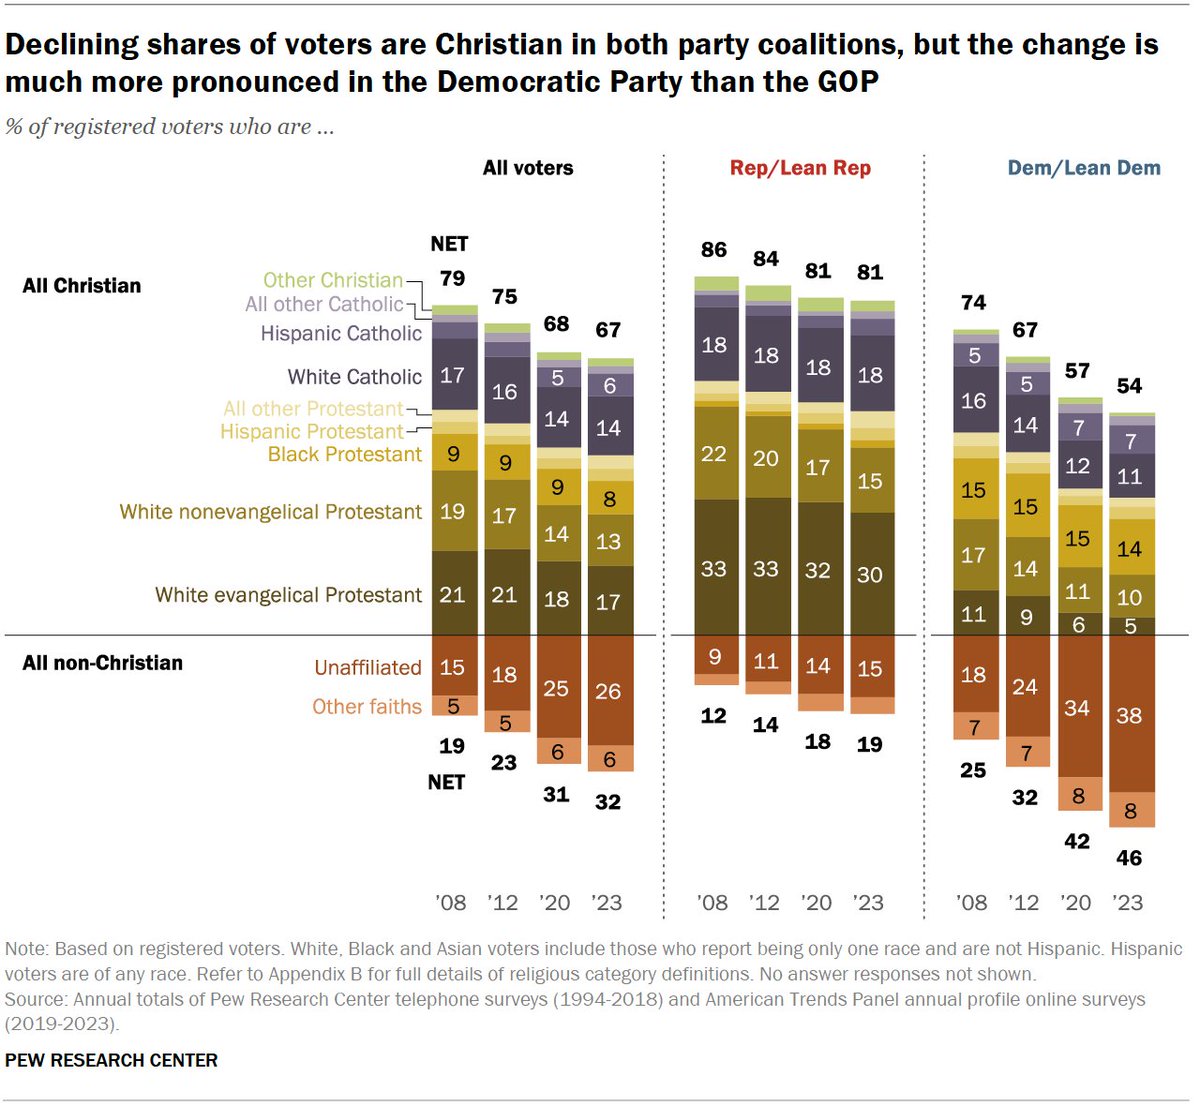
NEW Among the many differences in the composition of the Rep and Dem parties, religious affiliation is among the most striking. GOP continues to be overwhelmingly made up of Christians. Dem Party is now 46% non-Christian, up from 25% in 2008.
pewresearch.org/politics/?p=20…

NEW Among the many differences in the composition of the Rep and Dem parties, religious affiliation is among the most striking. GOP continues to be overwhelmingly made up of Christians. Dem Party is now 46% non-Christian, up from 25% in 2008. pewresearch.org/politics/?p=20…
account_circle
Kristen Soltis Anderson(@KSoltisAnderson) 's Twitter Profile Photo

Love this Pew Research Center chart. 1980s kids (older millennials) have moved a bit away from the Democratic Party over a 20 year window. The 1990s kids (young millennials/old gen z-ers) meanwhile have not moved at all.
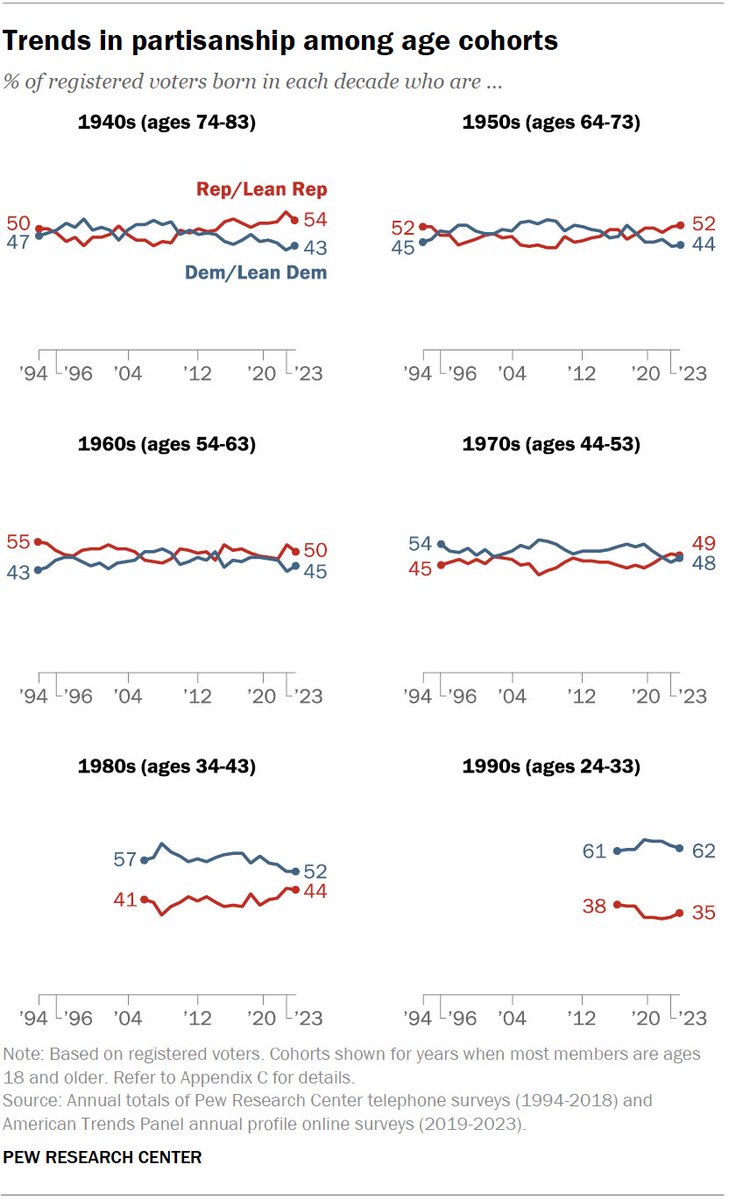
Love this @pewresearch chart. 1980s kids (older millennials) have moved a bit away from the Democratic Party over a 20 year window. The 1990s kids (young millennials/old gen z-ers) meanwhile have not moved at all.
account_circle
Kristen Soltis Anderson(@KSoltisAnderson) 's Twitter Profile Photo

New Pew report on party identification just dropped -> remember, young voters breaking more heavily Dem than their elders is a 2000s onward phenomenon, not 'how it always has been' pewresearch.org/politics/2024/…

New Pew report on party identification just dropped -> remember, young voters breaking more heavily Dem than their elders is a 2000s onward phenomenon, not 'how it always has been' pewresearch.org/politics/2024/…
account_circle
Carroll Doherty(@CarrollDoherty) 's Twitter Profile Photo

From last yr, agree w/ Dem Party/Rep Party on abortion:
Women agree w/ Dems 43%-26% (29% agree w/ neither party)
Men agree w/ Dems 44%-36% (19% neither);
Under age 50 agree w/ Dems 47%-27% (24% neither)
50 and older agree w/ Dems 38%-35% (25% neither).

From last yr, agree w/ Dem Party/Rep Party on abortion: Women agree w/ Dems 43%-26% (29% agree w/ neither party) Men agree w/ Dems 44%-36% (19% neither); Under age 50 agree w/ Dems 47%-27% (24% neither) 50 and older agree w/ Dems 38%-35% (25% neither).
account_circle
The New Yorker(@NewYorker) 's Twitter Profile Photo

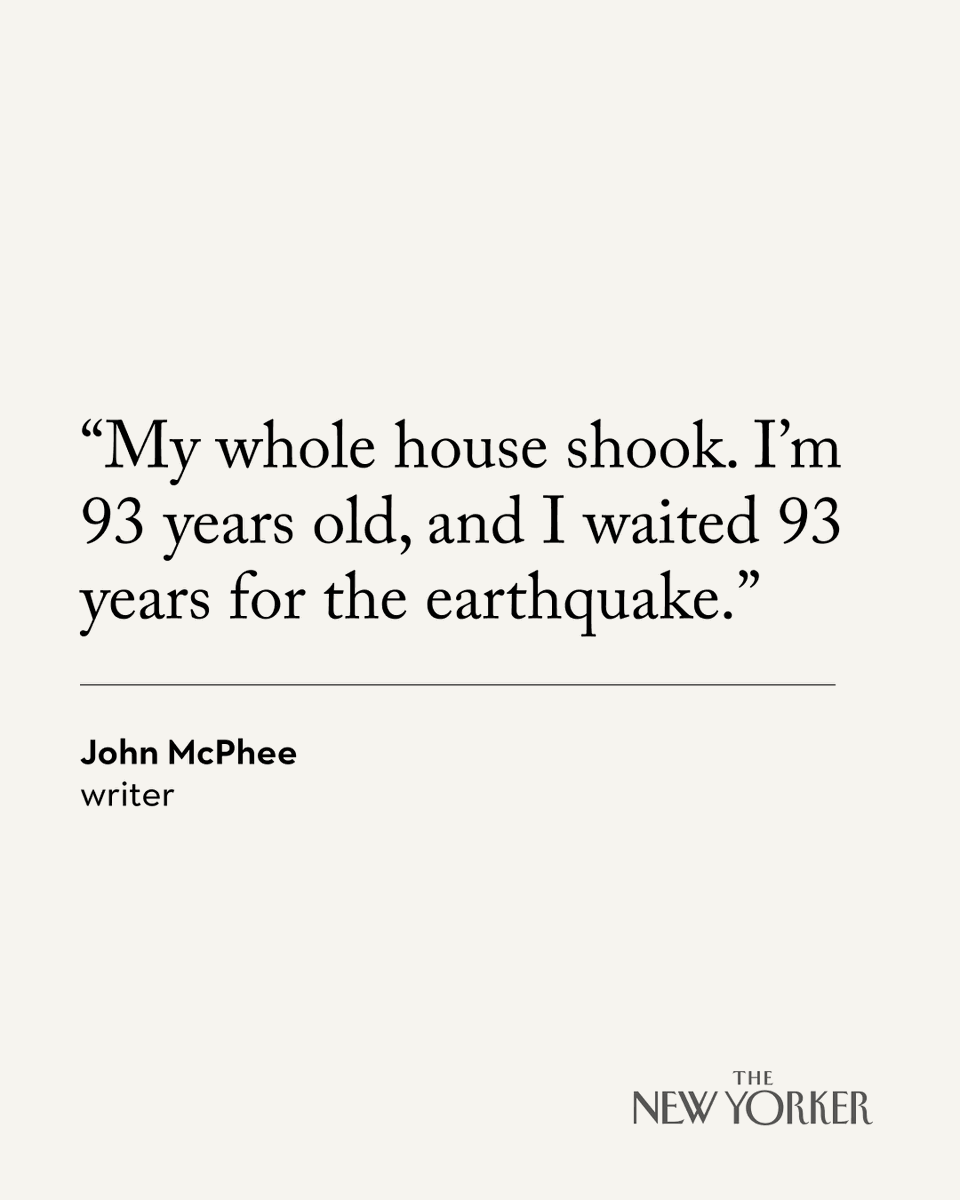
In today’s Daily Newsletter, the writer John McPhee tells a science editor about his first time experiencing an earthquake: today, at his home in Princeton, New Jersey. Read more: nyer.cm/gX8t8mA

In today’s Daily Newsletter, the writer John McPhee tells a science editor about his first time experiencing an earthquake: today, at his home in Princeton, New Jersey. Read more: nyer.cm/gX8t8mA
account_circle
Steve Futterman(@sfutterman) 's Twitter Profile Photo

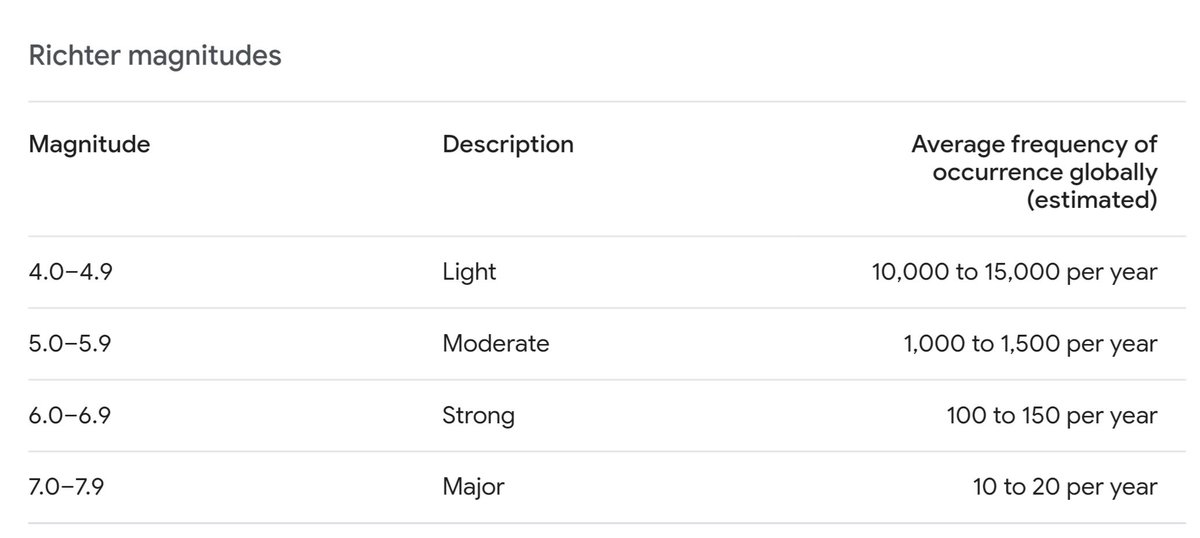
Putting a 4.8 magnitude earthquake in perspective.

'Generally causes zero to minimal damage. Moderate to significant damage is very unlikely. Some objects may fall off shelves or be knocked over.'

Putting a 4.8 magnitude earthquake in perspective. 'Generally causes zero to minimal damage. Moderate to significant damage is very unlikely. Some objects may fall off shelves or be knocked over.'
account_circle
John Gramlich(@johngramlich) 's Twitter Profile Photo

Big new Pew Research Center survey of public K-12 teachers in the US paints a gloomy picture: Teachers are far less satisfied with their jobs than other workers, and 82% say the state of public education has gotten worse in the last five years. Full study: pewrsr.ch/3J3kBQ7

account_circle
Justin Wolfers(@JustinWolfers) 's Twitter Profile Photo

“In the poorest 1% of zip codes that have lottery retailers, the average American adult spends around $600 a year, or nearly 5% of their income, on tickets. That compares with just $150, or 0.15%, for those in the richest 1% of zip codes.”
economist.com/graphic-detail…

“In the poorest 1% of zip codes that have lottery retailers, the average American adult spends around $600 a year, or nearly 5% of their income, on tickets. That compares with just $150, or 0.15%, for those in the richest 1% of zip codes.” economist.com/graphic-detail…
account_circle