Matthew B Jané(@MatthewBJane) 's Twitter Profile Photo

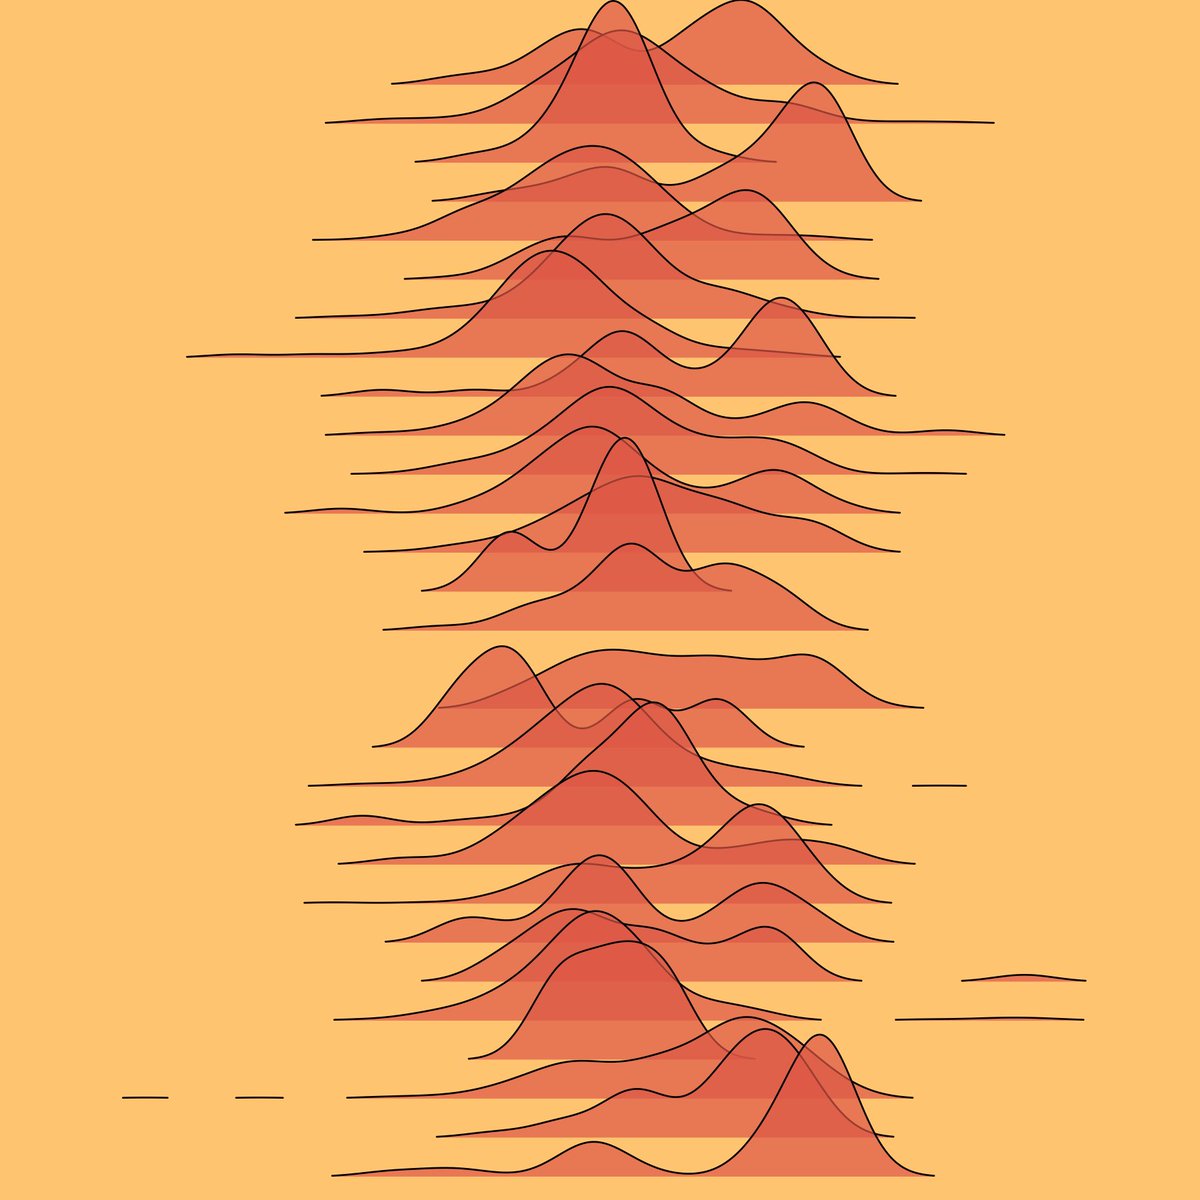
If anyone doesn’t know, the {ggdist} package is THE package for plotting distributions. It produces absolutely gorgeous figures of analytic or data distributions. Aside from {ggplot2}, this is probably the package I use the most for dataviz.

If anyone doesn’t know, the {ggdist} package is THE package for plotting distributions. It produces absolutely gorgeous figures of analytic or data distributions. Aside from {ggplot2}, this is probably the package I use the most for dataviz.
account_circle
Joachim Schork(@JoachimSchork) 's Twitter Profile Photo

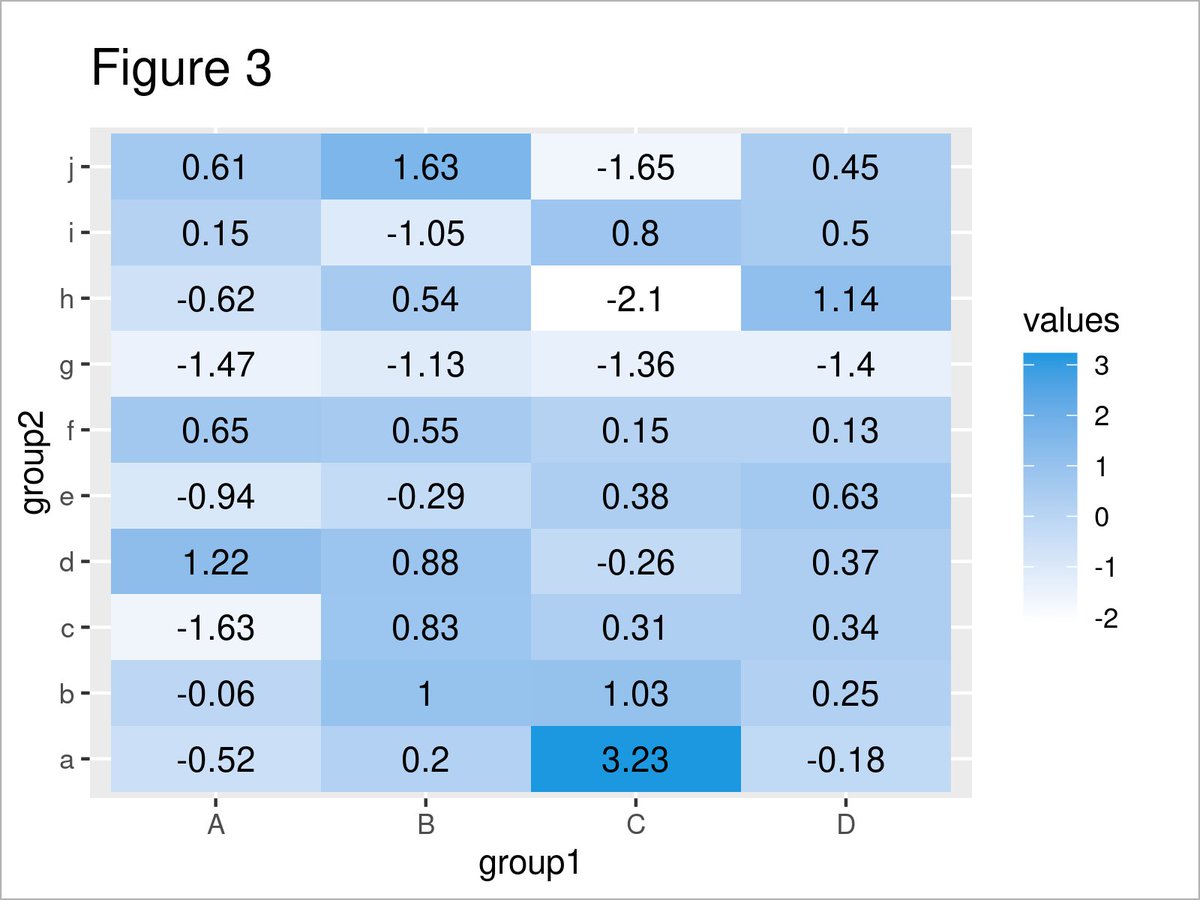
How to draw labels at the end of each line of a line plot using the ggplot2 and ggrepel packages in the R programming language: statisticsglobe.com/add-labels-at-…

How to draw labels at the end of each line of a line plot using the ggplot2 and ggrepel packages in the R programming language: statisticsglobe.com/add-labels-at-…

#tidyverse #RStats #DataVisualization #DataViz #ggplot2
account_circle
Steven Ponce(@sponce1) 's Twitter Profile Photo

2024 | day 18 | relationships | Asian Development Bank (data day).
.
The data comes from the ADB. This is about Agriculture, Value Added (% of GDP) in Asia and the Pacific.
.
📂: github.com/poncest/30DayC…
.
| | |

2024 #30DayChartChallenge | day 18 | relationships | Asian Development Bank (data day).
.
The data comes from the ADB. This #viz is about Agriculture, Value Added (% of GDP) in Asia and the Pacific.
.
📂: github.com/poncest/30DayC…
.
#rstats | #dataviz | #rstats | #ggplot2
account_circle
Gary Acosta(@garyacostag) 's Twitter Profile Photo

7. Data Science: Visualization

Learn basic data visualization principles and how to apply them using ggplot2.

What you'll learn:

- Data visualization principles
- How to communicate data-driven findings, and more

edx.org/learn/data-vis…

7. Data Science: Visualization

Learn basic data visualization principles and how to apply them using ggplot2.

What you'll learn:

- Data visualization principles
- How to communicate data-driven findings, and more

edx.org/learn/data-vis…
account_circle
Steven Ponce(@sponce1) 's Twitter Profile Photo

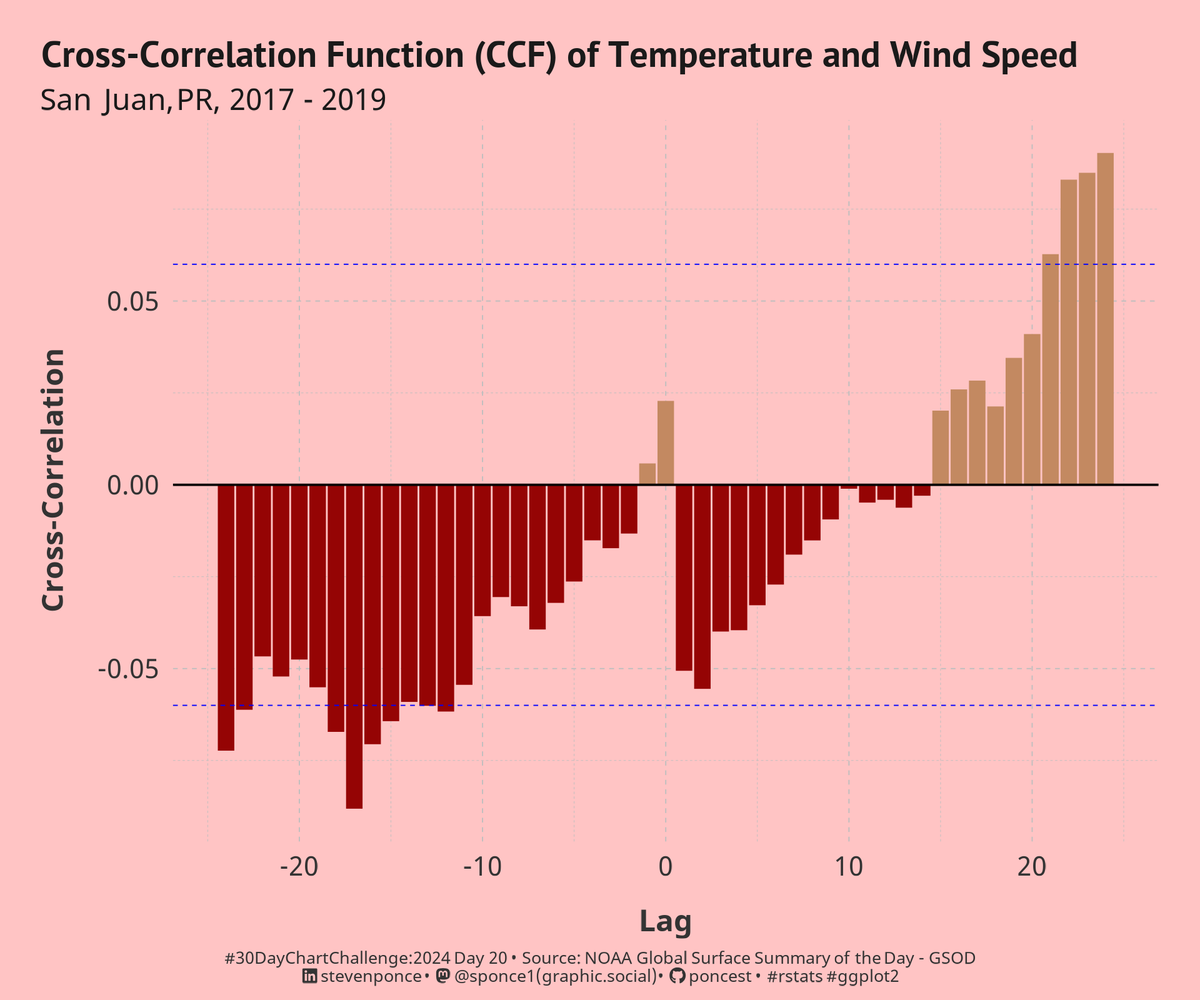
2024 | day 20 | timeseries | correlation
.
This analysis uses NOAA's GSOD dataset to explore the potential relationship between temperature and wind speed in San Juan, PR, 2017 – 2019.
.
📂: github.com/poncest/30DayC…
.
| | |

2024 #30DayChartChallenge | day 20 | timeseries | correlation
.
This analysis uses NOAA's GSOD dataset to explore the potential relationship between temperature and wind speed in San Juan, PR, 2017 – 2019.
.
📂: github.com/poncest/30DayC…
.
#rstats | #dataviz | #rstats | #ggplot2
account_circle
Statistics Of Portugal(@StatsOfPortugal) 's Twitter Profile Photo

🇵🇹Portugal celebrates 50 Years of Freedom.
25th April 1974. This historic day marked the Carnation Revolution, which brought an end to the 48-year dictatorship in Portugal.

🇵🇹Portugal celebrates 50 Years of Freedom.
25th April 1974. This historic day marked the Carnation Revolution, which brought an end to the 48-year dictatorship in Portugal.
#Portugal #rstats #dataviz #25abril #30DayChartChallenge #ggplot2
account_circle
Louis NADALIN, Mosquitologist 🦟(@LouisNadalin) 's Twitter Profile Photo

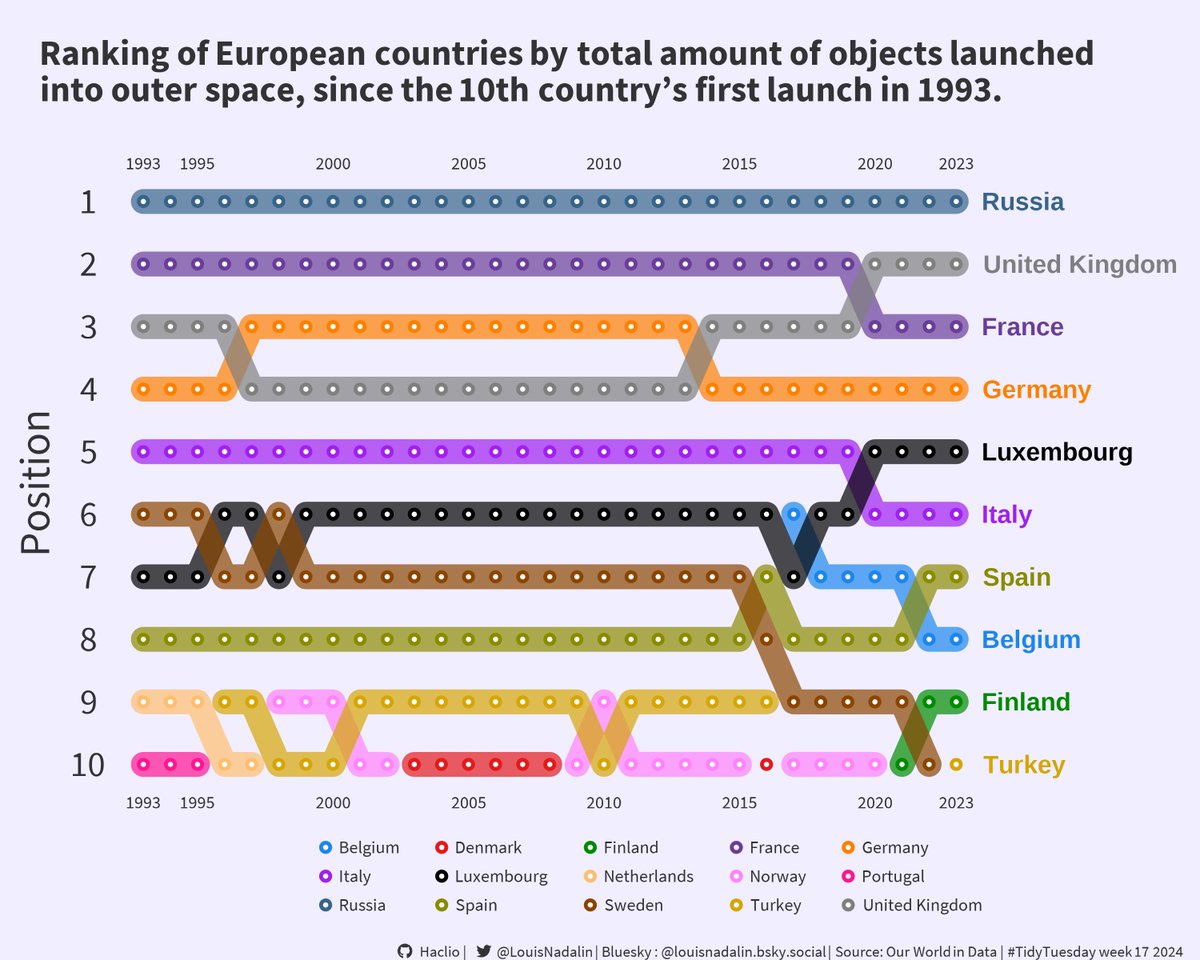
This week's : objects in outer space. I chose to focus on the 10 most active European countries. Tried to use {ggbump} but ran into issues, but lines work pretty well.
Code: github.com/Haclio/TidyTue…

This week's #TidyTuesday: objects in outer space. I chose to focus on the 10 most active European countries. Tried to use {ggbump} but ran into issues, but lines work pretty well.
Code: github.com/Haclio/TidyTue…
#dataviz #Rstats #R4DS #ggplot2
account_circle
Victor Eduardo 🥏(@micosapiens711) 's Twitter Profile Photo

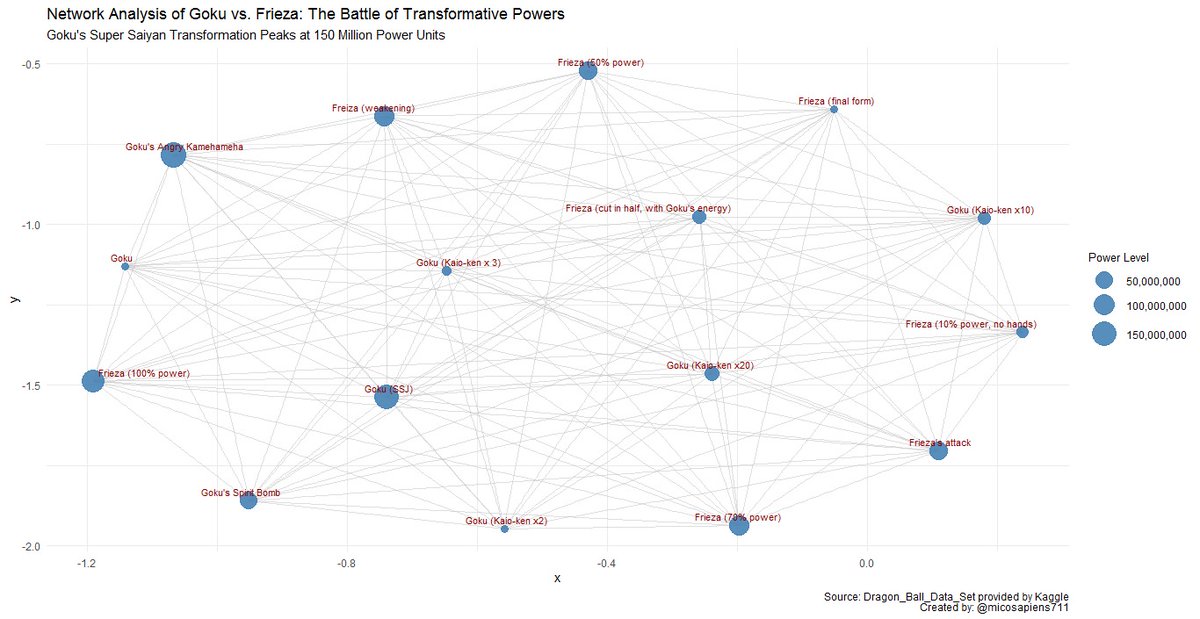
Not sure about you, but for me, this is one of the most impressive battles ever witnessed in anime history. If you know a better one, let me know. 🟠🐉| Networks | Day 17 of |

Not sure about you, but for me, this is one of the most impressive battles ever witnessed in anime history. If you know a better one, let me know. 🟠🐉| Networks | Day 17 of #30DayChartChallenge | #rstats #ggplot2 #dataviz #ggraph #igraph #DBZ
account_circle
Steven Ponce(@sponce1) 's Twitter Profile Photo

2024 | day 25 | uncertainties | global change
.
This analysis uses NOAA's OCADS dataset to explore potential ocean acidification on the US East Coast from May to October 2023.
.
📂: github.com/poncest/30DayC…
.
| | |

2024 #30DayChartChallenge | day 25 | uncertainties | global change
.
This analysis uses NOAA's OCADS dataset to explore potential ocean acidification on the US East Coast from May to October 2023.
.
📂: github.com/poncest/30DayC…
.
#rstats | #dataviz | #rstats | #ggplot2
account_circle
Victor Eduardo 🥏(@micosapiens711) 's Twitter Profile Photo

On Day 20 of the , I've used time series to craft a Cross- plot dedicated to a place for which I'm deeply grateful, with its uniquely privileged climate. When you can, visit ! 🏕️🐵🦆🦋🐿️🦌🐇🐍|

On Day 20 of the #30DayChartChallenge, I've used time series to craft a Cross-#Correlation plot dedicated to a place for which I'm deeply grateful, with its uniquely privileged climate. When you can, visit #Bucay! 🏕️🐵🦆🦋🐿️🦌🐇🐍| #rstats #ggplot2 #dataviz #forecast #TSA
account_circle
Steven Ponce(@sponce1) 's Twitter Profile Photo

2024 | day 19 | timeseries | dinosaurs
.
The data comes from the IMDB website. This is about Dinosaurs, a family sitcom TV series that ran from 1991 to 1994.
.
📂: github.com/poncest/30DayC…
.
| | |

2024 #30DayChartChallenge | day 19 | timeseries | dinosaurs
.
The data comes from the IMDB website. This #viz is about Dinosaurs, a family sitcom TV series that ran from 1991 to 1994.
.
📂: github.com/poncest/30DayC…
.
#rstats | #dataviz | #rstats | #ggplot2
account_circle
Yuki(@YukitheJapanese) 's Twitter Profile Photo

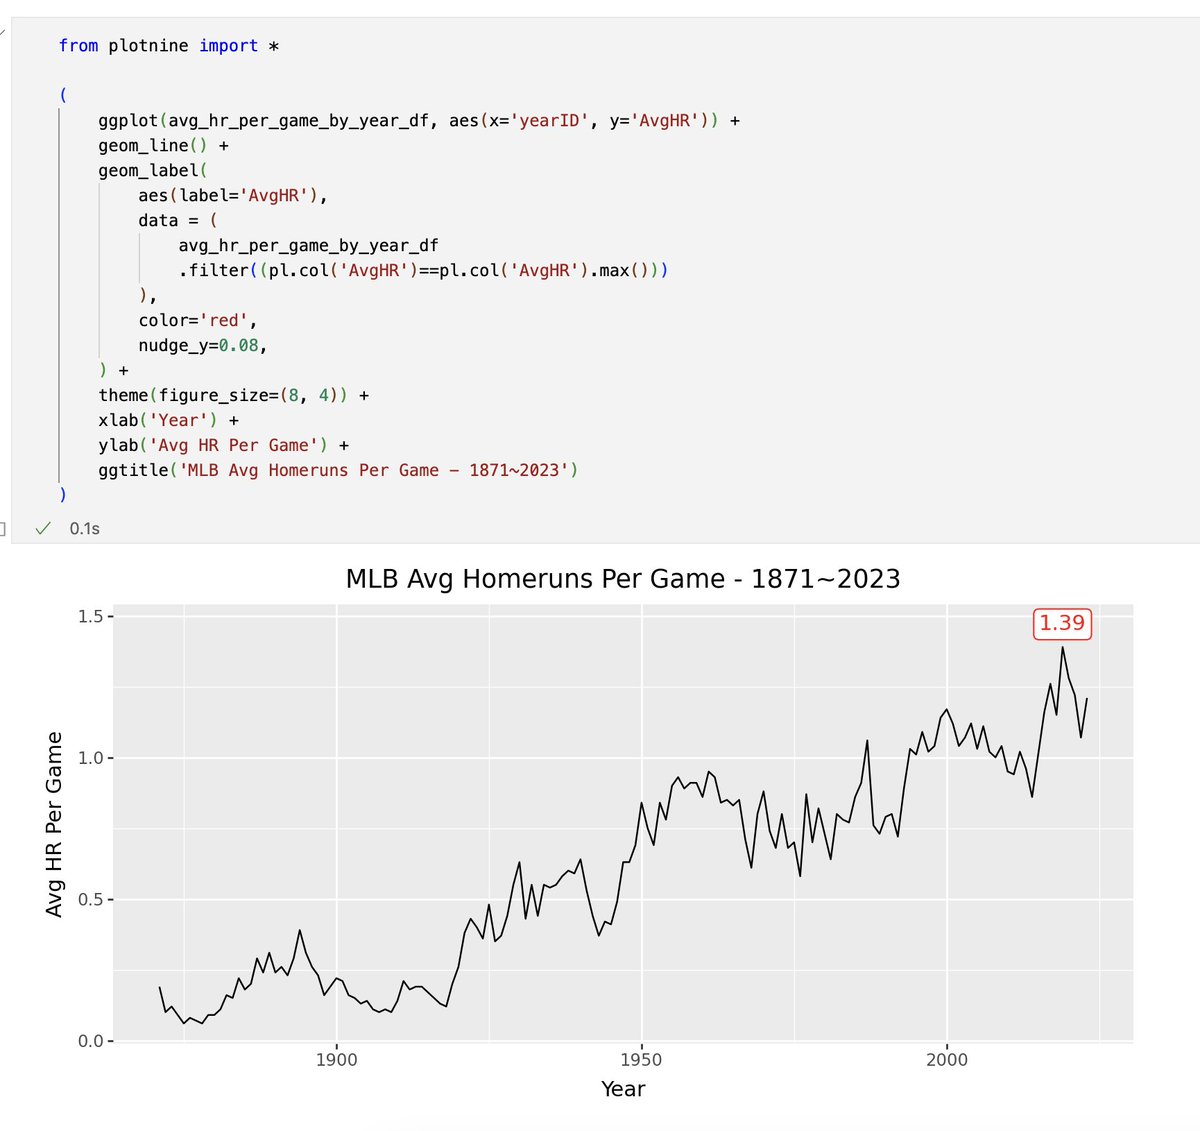
I feel I'm starting to get used to making graphs with ggplot2 syntax.

I like how I can keep adding stuff to a plot.

Hoping to do more complex baseball analysis over time as I get more comfortable with baseball stats and data!

I feel I'm starting to get used to making graphs with ggplot2 syntax. 

I like how I can keep adding stuff to a plot.

Hoping to do more complex baseball analysis over time as I get more comfortable with baseball stats and data! 

#python #ggplot2 #dataviz #sabermetrics
account_circle
Ansgar Wolsing(@_ansgar) 's Twitter Profile Photo

Development of the working poverty rate for the countries with the highest decrease and increase in Africa from 2000 to 2023. 🌍

| | Data Day: ILO region for Africa 📊

Development of the working poverty rate for the countries with the highest decrease and increase in Africa from 2000 to 2023. 🌍

#30DayChartChallenge | #Day24 | Data Day: ILO region for Africa #rstats 📊 #ggplot2
account_circle