Gunnar Myhre(@gunnarmy) 's Twitter Profileg
Gunnar Myhre

@gunnarmy

Climate researcher at CICERO og langrennsinteressert

ID:102024049

calendar_today05-01-2010 10:25:26

1,0K Tweets

504 Followers

271 Following

OOIR(@ObserveIR) 's Twitter Profile Photo

Trending in :
ooir.org/index.php?fiel…

1) New water accounting reveals why the Colorado River no longer reaches the sea (Communications Earth & Environment)

2) California dominates U.S. emissions of the pesticide & potent greenhouse gas sulfuryl fluoride (Communications Earth & Environment)

3) Potential for
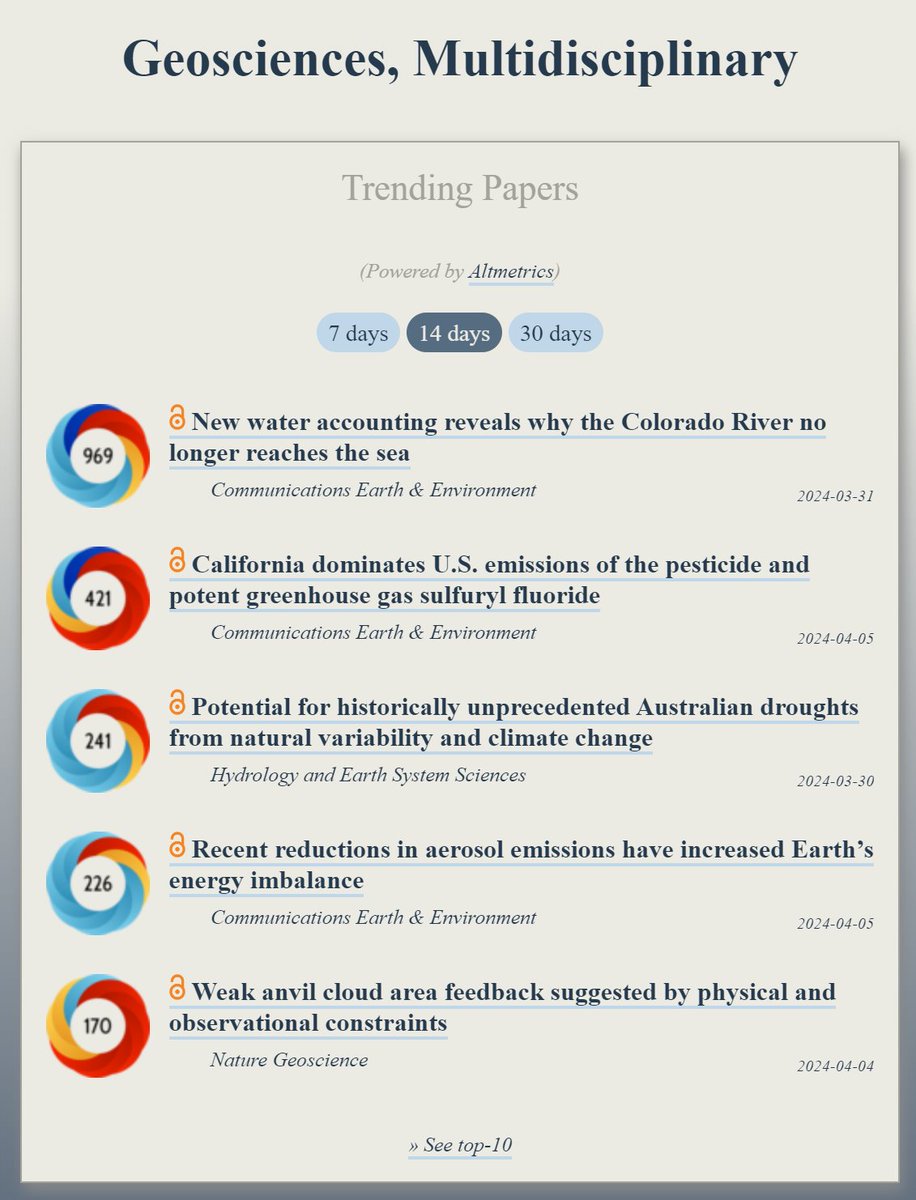
Trending in #Geosciences: ooir.org/index.php?fiel… 1) New water accounting reveals why the Colorado River no longer reaches the sea (@CommsEarth) 2) California dominates U.S. emissions of the pesticide & potent greenhouse gas sulfuryl fluoride (@CommsEarth) 3) Potential for
account_circle
HYDRA EU Project ⚡💧(@hydra_euproject) 's Twitter Profile Photo

📌 Interested in understanding the benefits and risks of the economy? 👇
EGU
🗺 Vienna (Austria) or online
⏰ Thu, 18 Apr | 2pm
👉Session AS3.26 | Room M1
Composition-Climate Interactions: Hydrogen, Ozone and Aerosols.

See you there 👋

📌 Interested in understanding the benefits and risks of the #hydrogen economy? 👇 ➡ @EuroGeosciences 🗺 Vienna (Austria) or online ⏰ Thu, 18 Apr | 2pm 👉Session AS3.26 | Room M1 Composition-Climate Interactions: Hydrogen, Ozone and Aerosols. See you there 👋 #h2 #EGU24
account_circle
Glen Peters(@Peters_Glen) 's Twitter Profile Photo

CEDS is a peer-reviewed bottom up estimate of global emissions, & in a process-based sense, is the most robust (whether it is more accurate is hard to tell given uncertainties & poor data to verify).

Here is a comparison with the latest CEDS data and the SSP scenarios.

3/3

CEDS is a peer-reviewed bottom up estimate of global emissions, & in a process-based sense, is the most robust (whether it is more accurate is hard to tell given uncertainties & poor data to verify). Here is a comparison with the latest CEDS data and the SSP scenarios. 3/3
account_circle
Glen Peters(@Peters_Glen) 's Twitter Profile Photo

There has been a long term decline in SO2 emissions, potentially causing an acceleration in global warming.

Since 2020, ships have had stringent regulations on SO2 emissions, accelerating SO2 reductions.

But how much have SO2 emissions dropped since 2020?

1/

There has been a long term decline in SO2 emissions, potentially causing an acceleration in global warming. Since 2020, ships have had stringent regulations on SO2 emissions, accelerating SO2 reductions. But how much have SO2 emissions dropped since 2020? 1/
account_circle
Climate Change Tracker(@cct_earth) 's Twitter Profile Photo

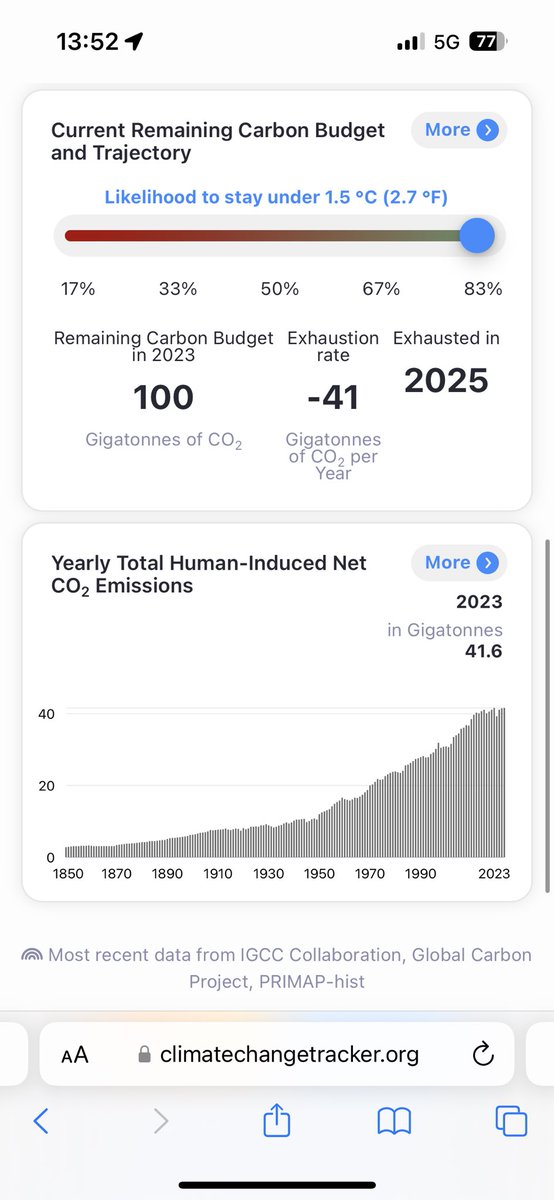
Climate Change Tracker is a unique, user friendly, up-to-date web app for accessing and understanding crucial climate change indicators.

Our unique data pipeline combines daily 40+ of the most relevant IPCC consistent climate data sources! 🙌

👉climatechangetracker.org

Climate Change Tracker is a unique, user friendly, up-to-date web app for accessing and understanding crucial climate change indicators. Our unique data pipeline combines daily 40+ of the most relevant @IPCC_CH consistent climate data sources! 🙌 👉climatechangetracker.org
account_circle
Carbon Brief(@CarbonBrief) 's Twitter Profile Photo

NEW – Factcheck: Why the recent ‘acceleration’ in global warming is what scientists expect | Zeke Hausfather

Read here: buff.ly/3U4HvN6

NEW – Factcheck: Why the recent ‘acceleration’ in global warming is what scientists expect | @hausfath Read here: buff.ly/3U4HvN6
account_circle
Leon Simons(@LeonSimons8) 's Twitter Profile Photo

📈BREAKING 📈

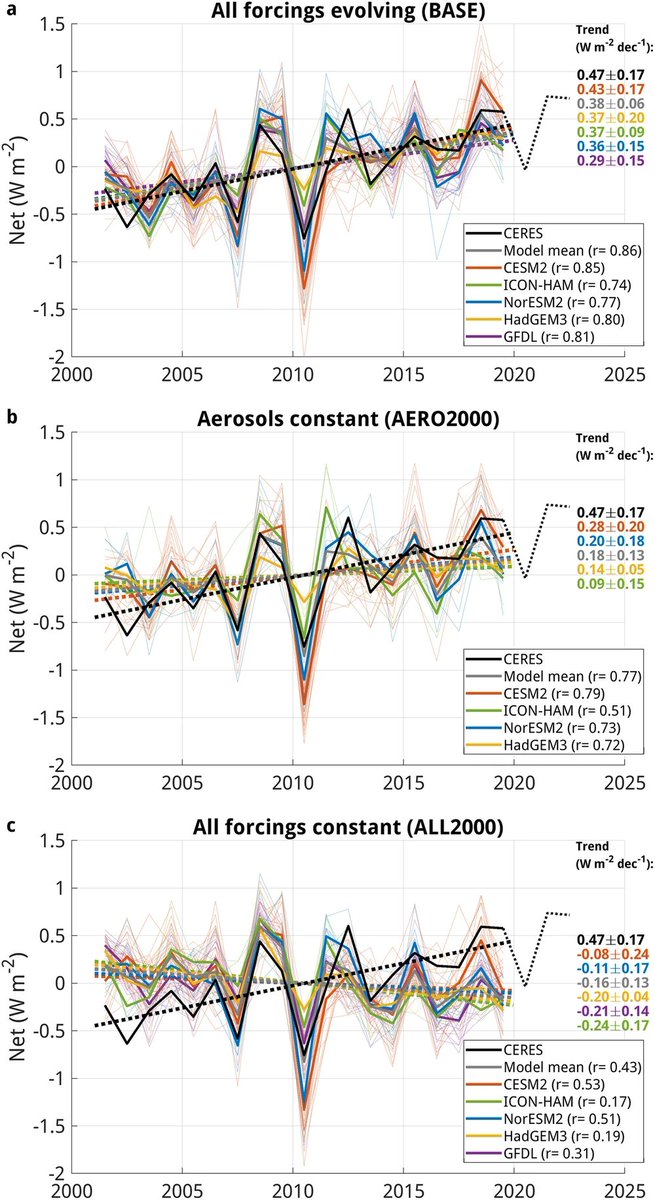
The most important NASA graph in the world confirms increased Earth's Energy Imbalance from aerosol reductions (+0.2 W/m²/decade) and increasing greenhouse gases (+0.34 W/m²/dec) up to 2019!

This doesn't even include 2020 shipping desulphurisation yet!!

📈BREAKING 📈 The most important @NASA graph in the world confirms increased Earth's Energy Imbalance from aerosol reductions (+0.2 W/m²/decade) and increasing greenhouse gases (+0.34 W/m²/dec) up to 2019! This doesn't even include 2020 shipping desulphurisation yet!!
account_circle
Prof. Eliot Jacobson(@EliotJacobson) 's Twitter Profile Photo

Breaking News!

March came in at 1.68°C above the 1850-1900 pre-industrial baseline, making it the 10th consecutive month at an all time recorded high, and the 9th consecutive month breaking the Paris limit of 1.5°C.

Breaking News! March came in at 1.68°C above the 1850-1900 pre-industrial baseline, making it the 10th consecutive month at an all time recorded high, and the 9th consecutive month breaking the Paris limit of 1.5°C.
account_circle
James Edward Hansen(@DrJamesEHansen) 's Twitter Profile Photo

Jump of global temperature in past year is a combination of aerosol-induced warming over a few years and a half-baked El Nino. There is no need for new climate physics to understand the warming. El Nino + next La Nina mean may approach 1.5°C. See Hopium - mailchi.mp/caa/global-war…

Jump of global temperature in past year is a combination of aerosol-induced warming over a few years and a half-baked El Nino. There is no need for new climate physics to understand the warming. El Nino + next La Nina mean may approach 1.5°C. See Hopium - mailchi.mp/caa/global-war…
account_circle
Chris Parker(@HyperHydr0) 's Twitter Profile Photo

The 12 month running average surface air temperature now up to 1.57°C relative to the historical baseline (1900-1850).

Reminder: this does not mean the Paris target has been exceeded however, it does mean that we are getting closer.

data: pulse.climate.copernicus.eu

The 12 month running average surface air temperature now up to 1.57°C relative to the historical baseline (1900-1850). Reminder: this does not mean the Paris target has been exceeded however, it does mean that we are getting closer. data: pulse.climate.copernicus.eu
account_circle
Gavin Schmidt(@ClimateOfGavin) 's Twitter Profile Photo

I have a commentary in Nature about our disquieting inability to explain why 2023 was so warm. nature.com/articles/d4158…

account_circle
Glen Peters(@Peters_Glen) 's Twitter Profile Photo

The annual atmospheric increase in CO2 was a whopping 3.4 parts per million (ppm) in 2023.

Sure, it was fueled by El Nino, but I don't think anyone had on their bingo cards this large an increase.

gml.noaa.gov/ccgg/trends/gr…

1/

The annual atmospheric increase in CO2 was a whopping 3.4 parts per million (ppm) in 2023. Sure, it was fueled by El Nino, but I don't think anyone had on their bingo cards this large an increase. gml.noaa.gov/ccgg/trends/gr… 1/
account_circle
Makiko Sato(@MakikoSato6) 's Twitter Profile Photo

Global mean temperature was record high for last 9 consecutive months. The current El Nino is not super but Jan-Feb temperatures were above 2016's due to the long-term global warming. Extreme warmth in the fall 2023 was probably not by El Nino. Data sources: NASA/GISS & NOAA/CPC.

Global mean temperature was record high for last 9 consecutive months. The current El Nino is not super but Jan-Feb temperatures were above 2016's due to the long-term global warming. Extreme warmth in the fall 2023 was probably not by El Nino. Data sources: NASA/GISS & NOAA/CPC.
account_circle