Daily Chartbook
@dailychartbook
The day's best charts & insights, curated: dailychartbook.com
ID: 1550094509899489280
https://www.dailychartbook.com/c/about 21-07-2022 12:25:14
26,26K Tweet
27,27K Takipçi
392 Takip Edilen

"According to this model, the current expectations for the S&P 500's annualized ten-year return range from -0.50% to +3.50%." Michael Lebowitz, CFA


"Between 2022 and 2026, [hyperscalers] will have made a whopping $1.14 trillion in capital expenditures, or three times what they did in the preceding five years." Spencer Jakab
![Daily Chartbook (@dailychartbook) on Twitter photo "Between 2022 and 2026, [hyperscalers] will have made a whopping $1.14 trillion in capital expenditures, or three times what they did in the preceding five years."
<a href="/Spencerjakab/">Spencer Jakab</a> "Between 2022 and 2026, [hyperscalers] will have made a whopping $1.14 trillion in capital expenditures, or three times what they did in the preceding five years."
<a href="/Spencerjakab/">Spencer Jakab</a>](https://pbs.twimg.com/media/GsZi3qcWYAIzXkN.jpg)

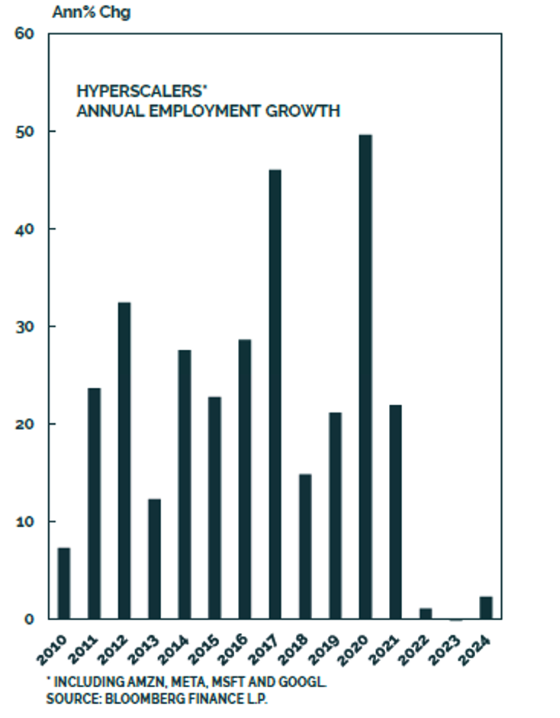
"One way the hyperscalers have been able to keep margins high despite the historic rise in capex is by cutting back on operating cost. Headcount has been frozen over the past 3 years. Less people, More GPUs." Juan Correa-Ossa


"SLR reform is about boosting bank takedowns of Treasurys to offset reliance on foreign capital ... Looking at the low outstanding share of UST held at US-chartered banks, it is easy to see why Bessent views banks as a prime untapped source of funding for government." steven blitz


Thanks for the shoutout Michael Batnick! Great pod with Jens Nordvig! theirrelevantinvestor.com/p/investors-bo…


"The direction of inflation expectations, as measured by the five-year, five-year forward inflation expectation rate, has a near one-to-one impact on U.S. 10-year Treasury yields." Joseph Brusuelas


The S&P 500 "has increased between Memorial Day and Labor Day in eight out of the past nine years." Callie Cox


"Since 1970, June has been a strong month at the beginning but begins to weaken towards the middle of the month. June has been the fourth weakness month for equities but on average it has been positive." Andrew Thrasher, CMT


Security Sherpa Daily Chartbook dualityresearch.substack.com/t/sectorsnap


