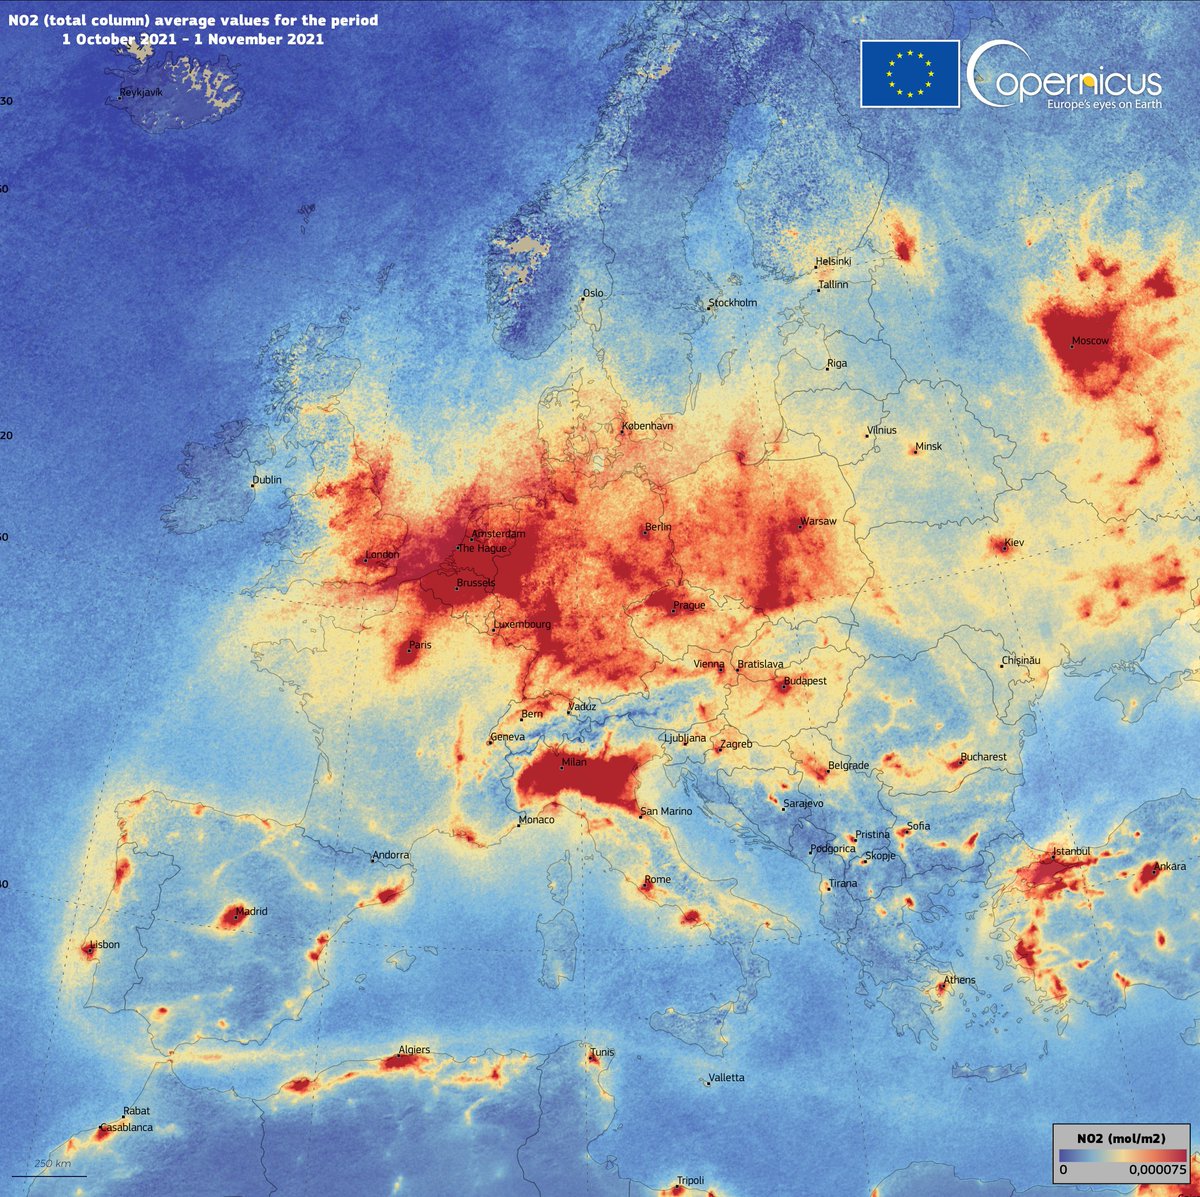
#DYK , the #CopernicusAtmosphere Service supplies the data behind the @Euronews Air Quality forecasts? 🏭
Using Copernicus Atmospheric environmental data, it provides viewers with up-to-date #AirQuality forecasts for major European cities 🏙️


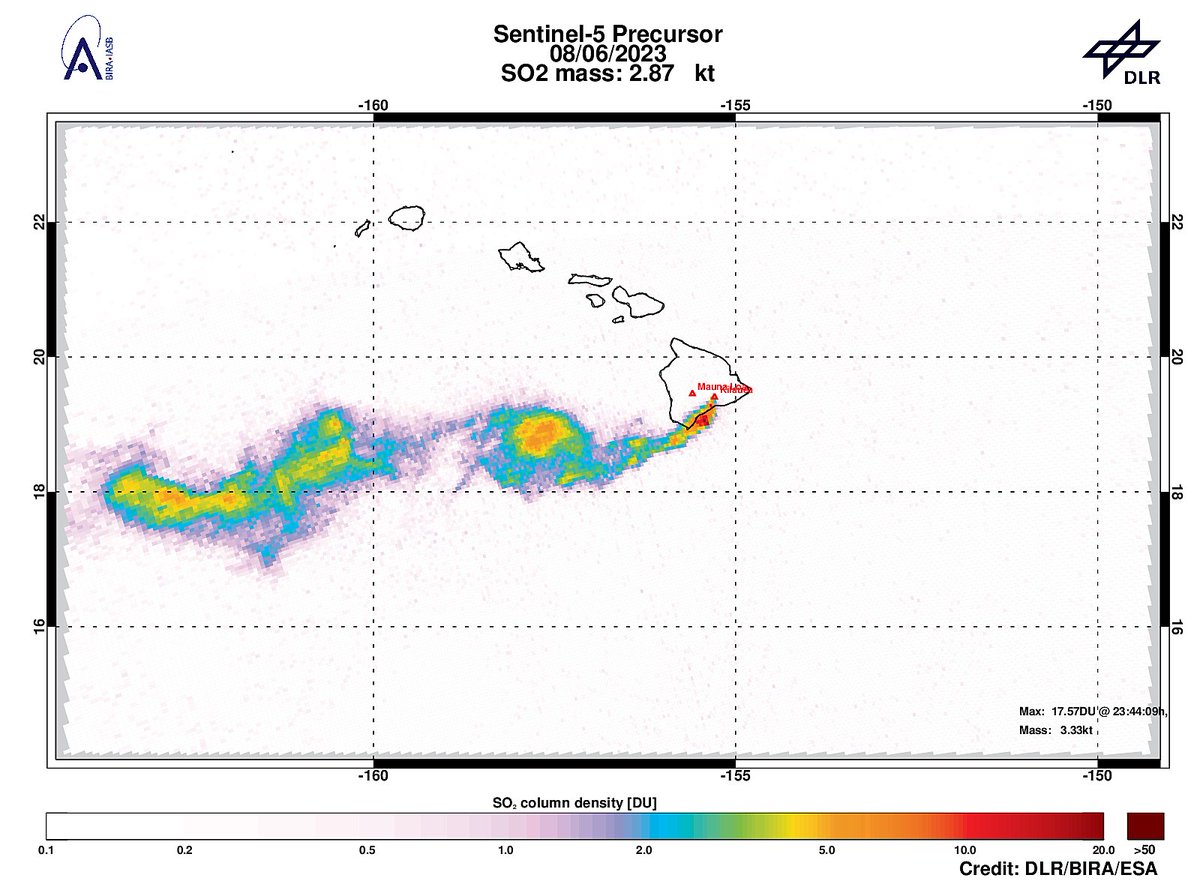
On 2023-06-08 #TROPOMI has detected an enhanced SO2 signal of 17.57DU at a distance of 42.7km to #Kilauea . Other nearby sources: #Mauna Loa. TROPOMI #S5p #Sentinel5p DLR - English BIRA-IASB ESA Earth Observation #SO2LH

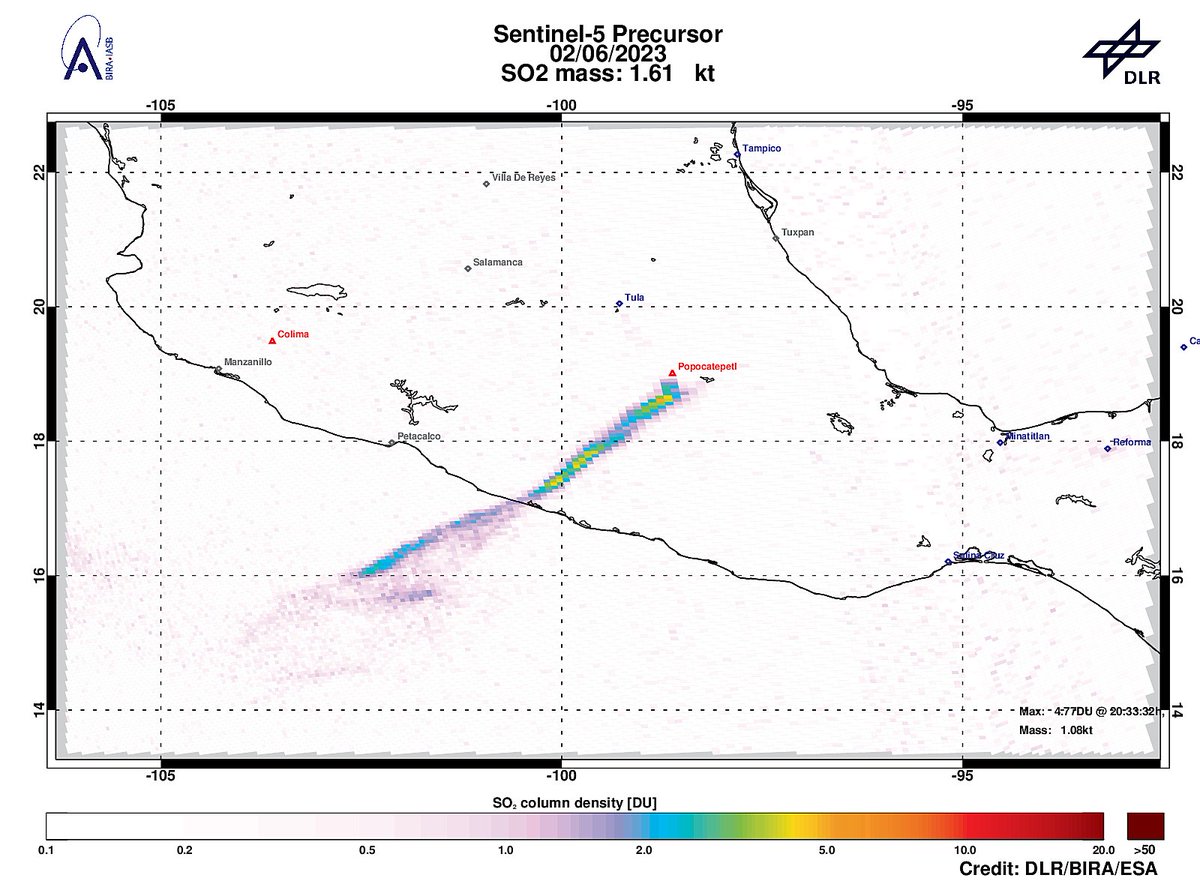
On 2023-06-02 #TROPOMI has detected an enhanced SO2 signal of 4.77DU at a distance of 48.6km to #Popocatepetl . TROPOMI #S5p #Sentinel5p DLR - English BIRA-IASB ESA Earth Observation #SO2LH

On 2023-06-05 #TROPOMI has detected an enhanced SO2 signal of 3.24DU at a distance of 12.7km to #Tinakula . TROPOMI #S5p #Sentinel5p DLR - English BIRA-IASB ESA Earth Observation #SO2LH


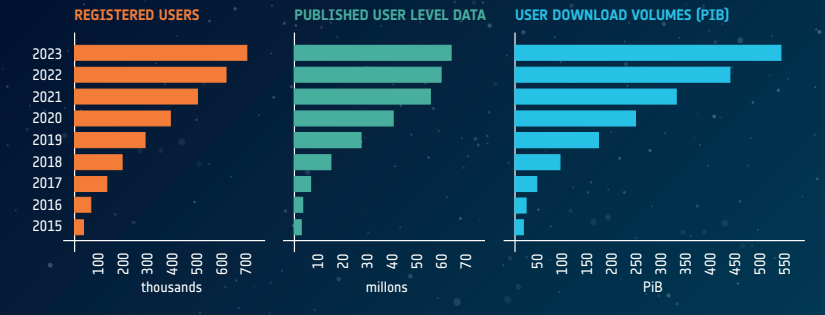
Since 2014 (when ESA started offering Sentinel data products) Copernicus EU gained:
🧑🤝🧑 705,000 registered users
🖥️62.4 million published products
⬇️550 PB of downloads
ESA offers COMPLETE, FREE, OPEN #Sentinel1 , #Sentinel2 , #Sentinel3 and #Sentinel5P products.
#Copernicus25

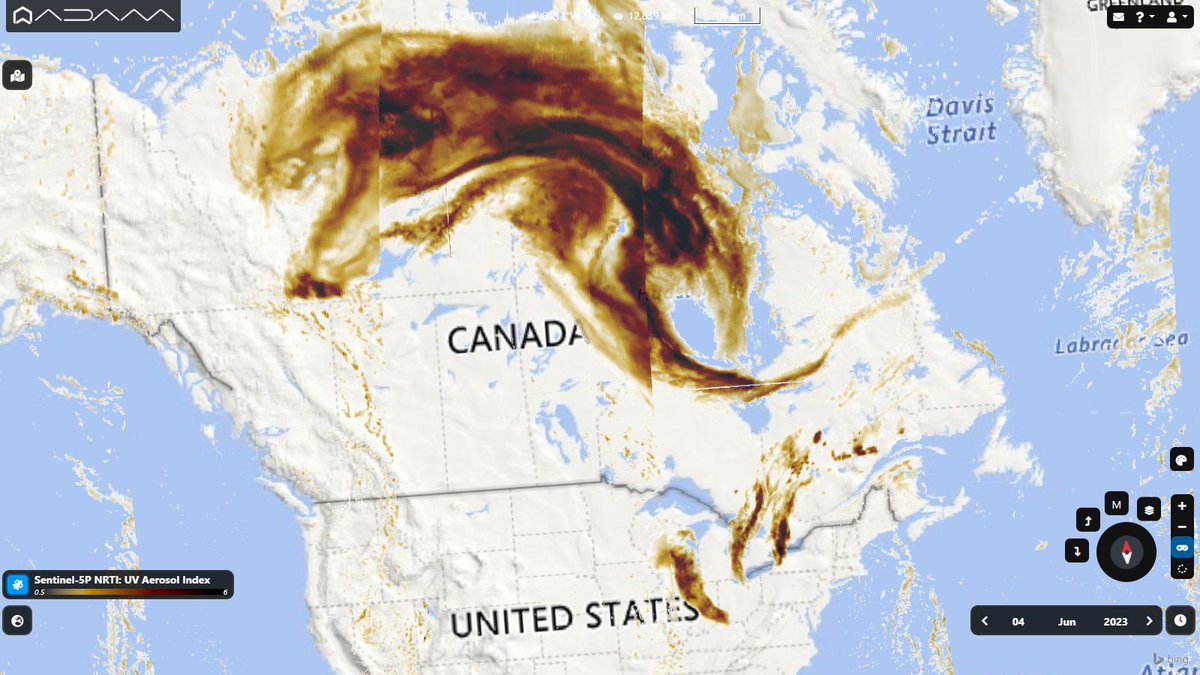
Huge smoke cloud over #Canada caused by the ongoing #wildfires . The #Copernicus #Sentinel5p on June 4th shows the big plume across the whole North America up to #Arctic , as forecasted by Copernicus ECMWF CAMS. #tropomi #AirQuality #ClimateEmergency
Cheryl in Nova Scotia 🍁🇨🇦🦞 Judy Trinh

Iban Ameztoy Copernicus EU Visualizing #Sentinel5p CO on top of GOES16, scaled to capture hotspots.
Code: code.earthengine.google.com/585727cfb4a61c…

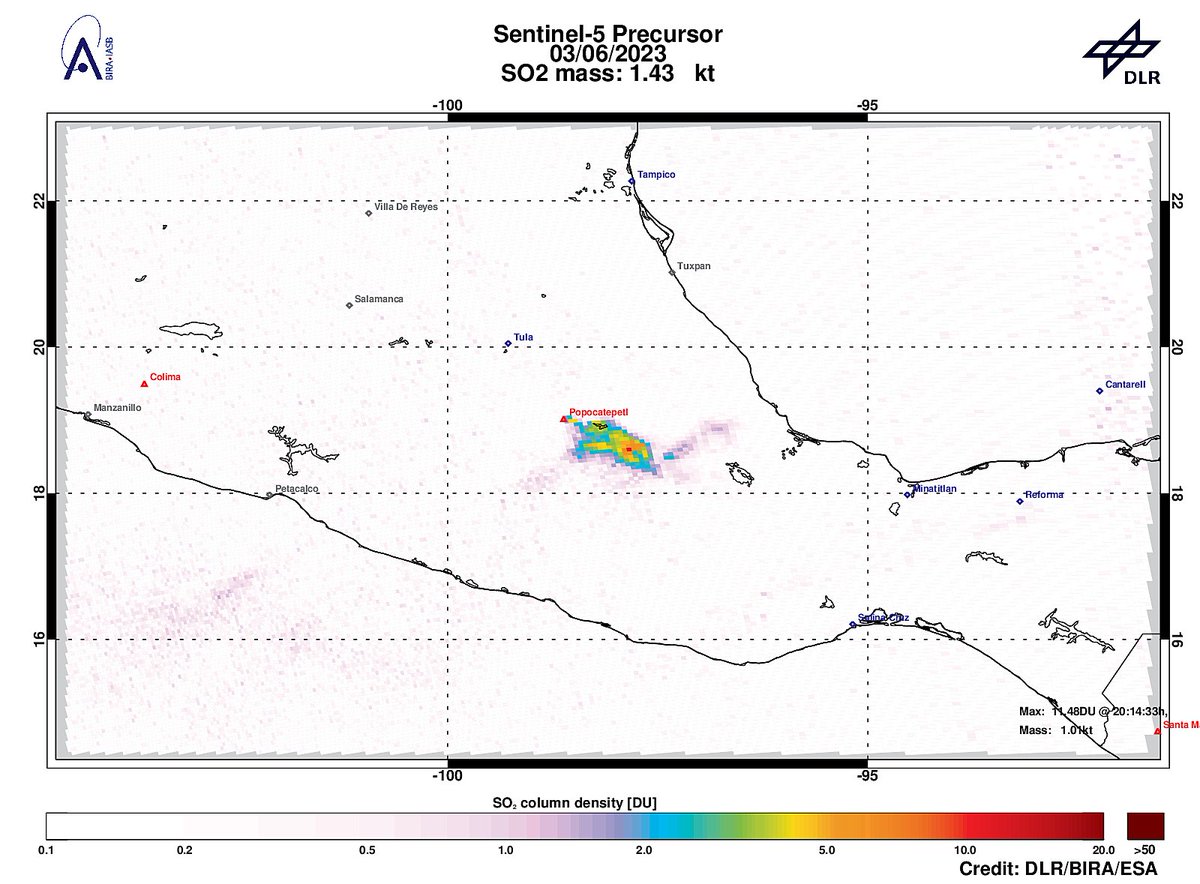
On 2023-06-03 #TROPOMI has detected an enhanced SO2 signal of 11.48DU at a distance of 94.5km to #Popocatepetl . TROPOMI #S5p #Sentinel5p DLR - English BIRA-IASB ESA Earth Observation #SO2LH


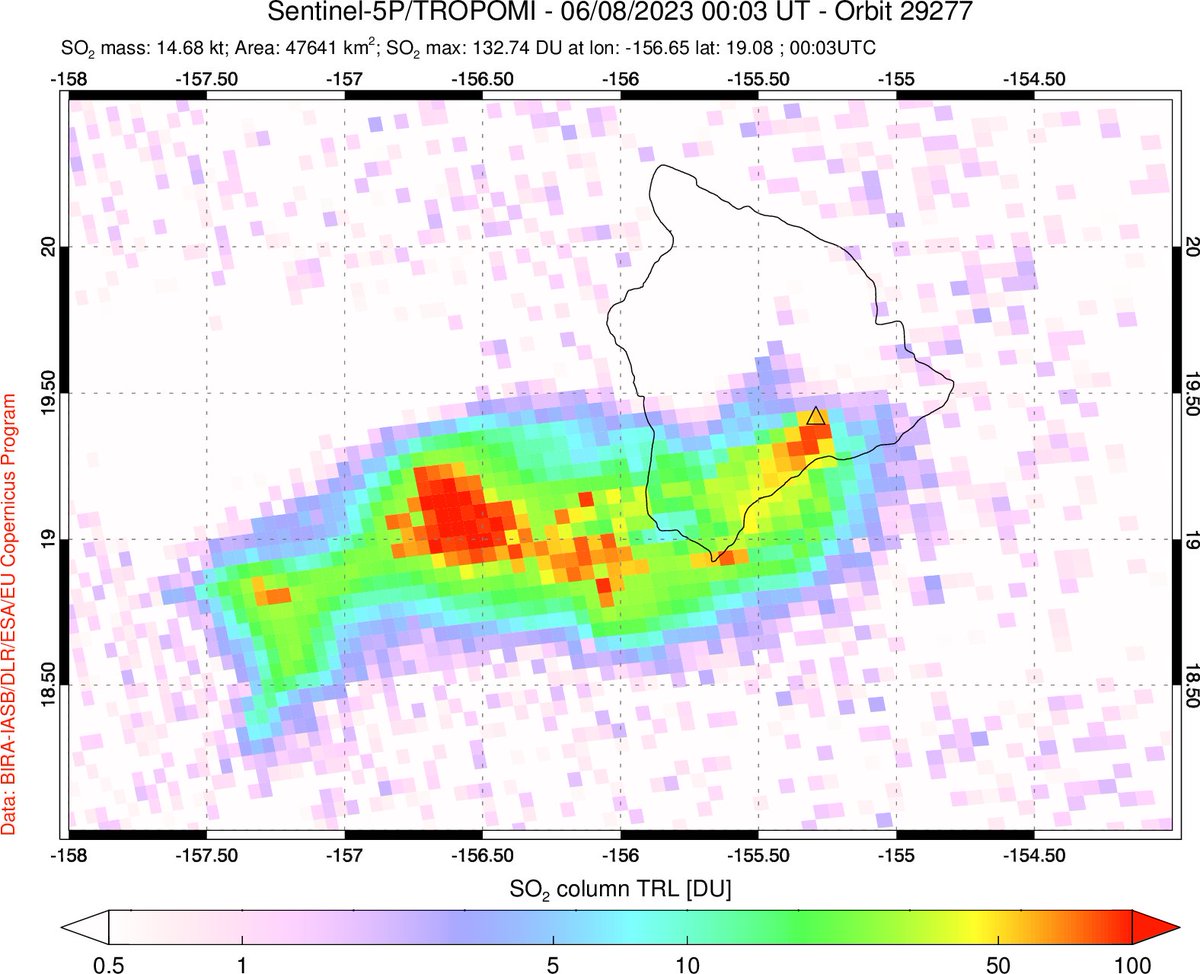
On 2023-06-07 #TROPOMI has detected an enhanced SO2 signal of 79.38DU at a distance of 7.0km to #Kilauea . Other nearby sources: #Mauna Loa. TROPOMI #S5p #Sentinel5p DLR - English BIRA-IASB ESA Earth Observation #SO2LH


USGS Volcanoes🌋 Appears consistent with #satellite data. #Sentinel5P #TROPOMI measured very high SO₂ columns in the #Kilauea plume on June 7, and estimated SO₂ fluxes are the same order of magnitude. #Kilauea Erupts Copernicus EU BIRA-IASB

#CarbonMonoxide from #Sentinel5p #TROPOMI on June 8 showing #smoke from the #CanadianWildfires being transported across the Eastern and Southern US. #AirQuality #GoogleEarthEngine
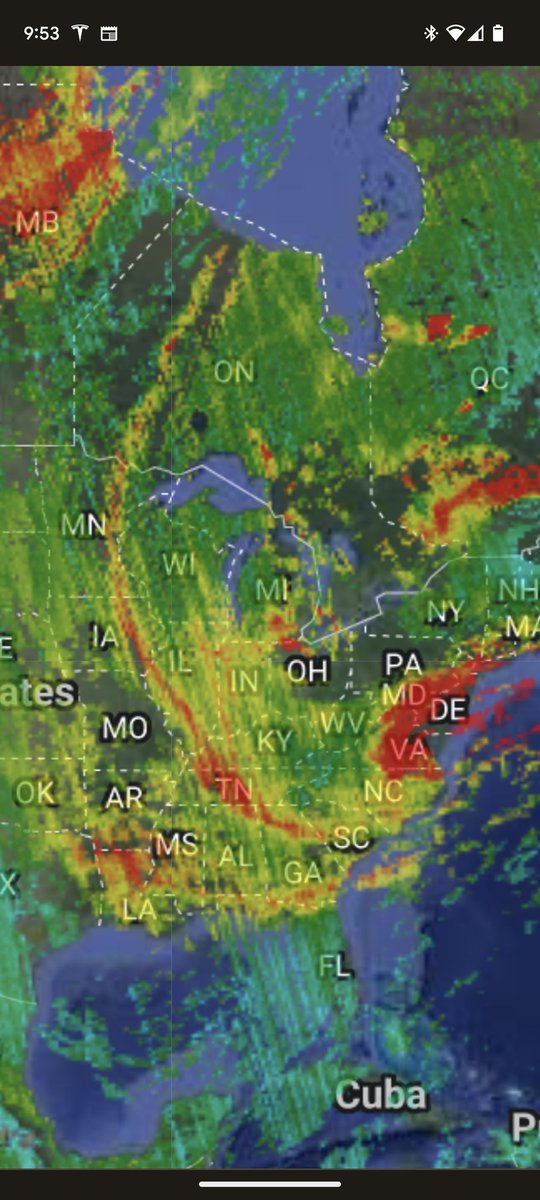

On 2023-06-09 #TROPOMI has detected an enhanced SO2 signal of 3.54DU at a distance of 9.4km to #Dukono . TROPOMI #S5p #Sentinel5p DLR - English BIRA-IASB ESA Earth Observation #SO2LH
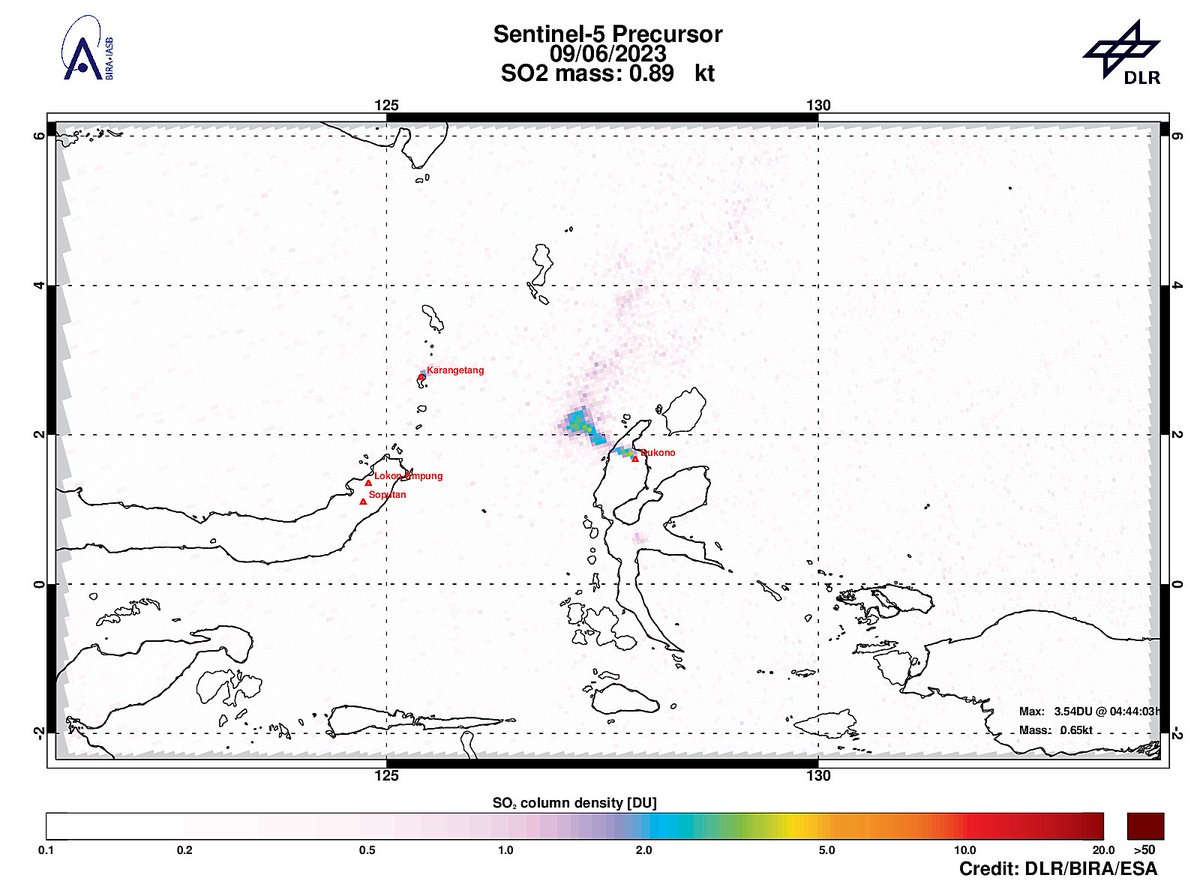


Those shipping lanes you see in average #Sentinel5p NO2 date do not exist in reality. When zooming to the daily scale all we see are small plumes (few km across, 50-100 km long). Lot of them, actually. The noise averages out, the plumes average in a vague blur: the shipping lane.


On 2023-06-12 #TROPOMI has detected an enhanced SO2 signal of 12.80DU at a distance of 2.8km to #Bezymianny . Other nearby sources: #Kliuchevskoi #Tolbatschik #Shiveluch . #DLR_inpuls TROPOMI #S5p #Sentinel5p DLR - English BIRA-IASB ESA Earth Observation #SO2LH


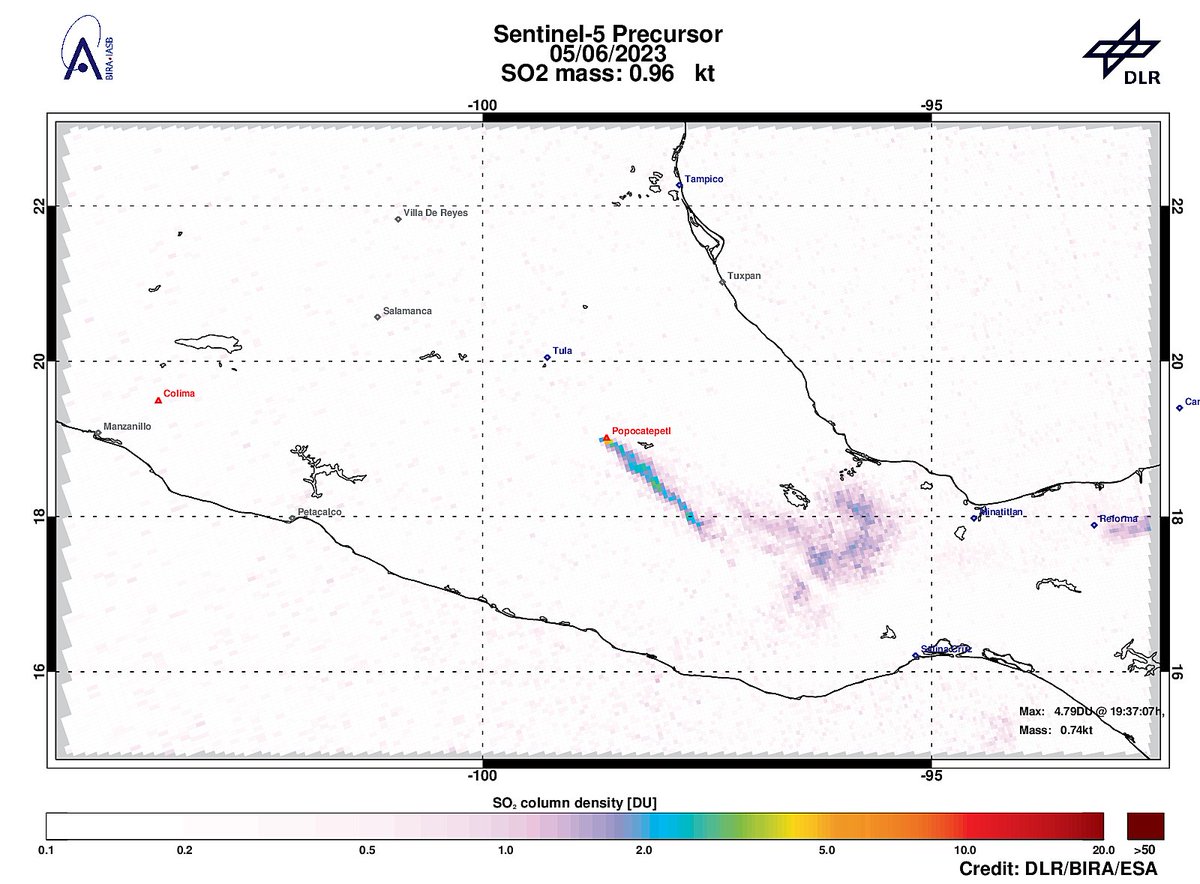
On 2023-06-05 #TROPOMI has detected an enhanced SO2 signal of 4.79DU at a distance of 7.4km to #Popocatepetl . TROPOMI #S5p #Sentinel5p DLR - English BIRA-IASB ESA Earth Observation #SO2LH


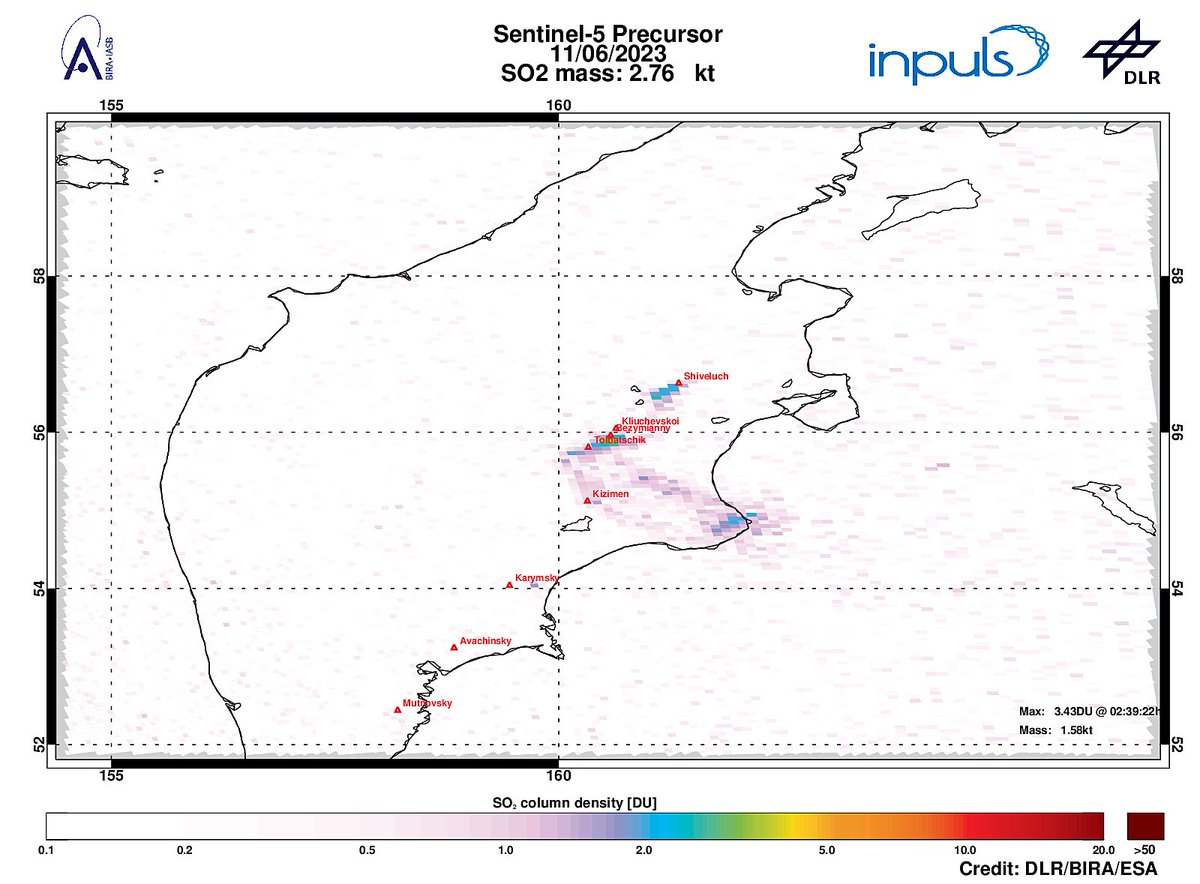
On 2023-06-11 #TROPOMI has detected an enhanced SO2 signal of 3.43DU at a distance of 8.4km to #Bezymianny . Other nearby sources: #Kliuchevskoi #Tolbatschik #Kizimen . #DLR_inpuls TROPOMI #S5p #Sentinel5p DLR - English BIRA-IASB ESA Earth Observation #SO2LH

Maximum CO levels between the 20th of May & 8th of June, 2023. It is clear who is the protagonist during this short period of time; #Wildfires in #Canada throwing all those smoke tongues that are even crossing the Atlantic ocean 🛰️🔥
Copernicus EU #Sentinel5p reduced in…

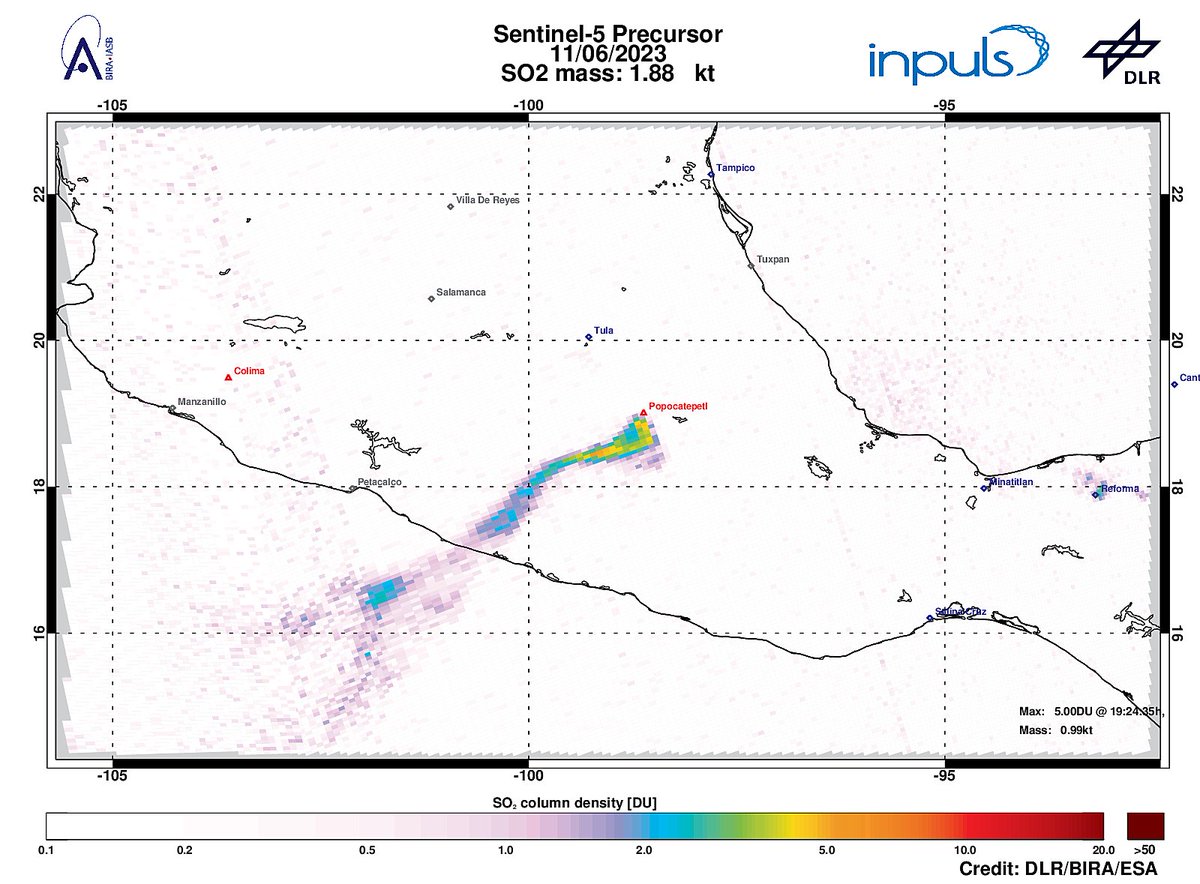
On 2023-06-11 #TROPOMI has detected an enhanced SO2 signal of 5.00DU at a distance of 90.2km to #Popocatepetl . #DLR_inpuls TROPOMI #S5p #Sentinel5p DLR - English BIRA-IASB ESA Earth Observation #SO2LH

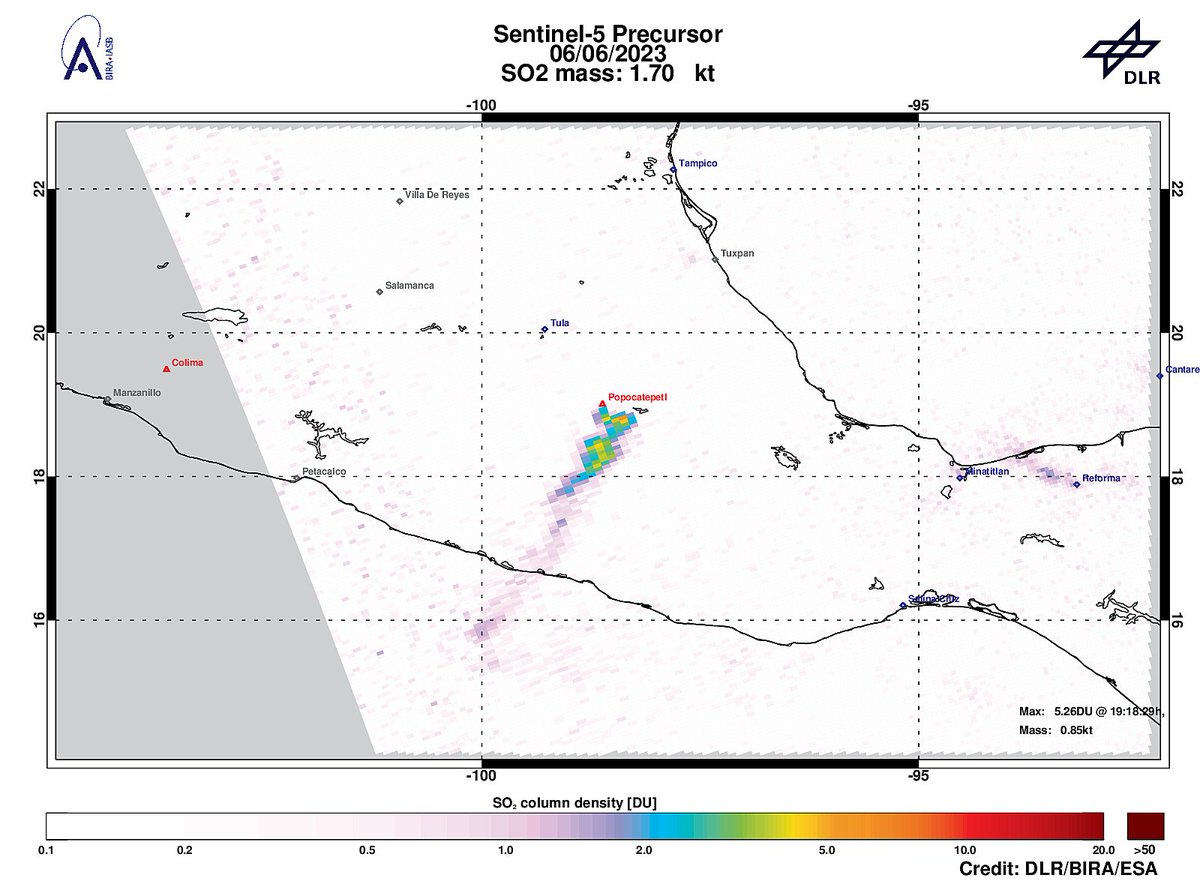
On 2023-06-06 #TROPOMI has detected an enhanced SO2 signal of 5.26DU at a distance of 33.1km to #Popocatepetl . TROPOMI #S5p #Sentinel5p DLR - English BIRA-IASB ESA Earth Observation #SO2LH
