Scott Brown, CMT (@scottcharts) 's Twitter Profile
Scott Brown, CMT

@scottcharts

Founder, Brown Technical Insights. Essential insights into market trends, technicals and opportunities

ID: 1408022505655263233

linkhttp://www.BrownInsights.com calendar_today24-06-2021 11:21:46

1,1K Tweet

5,5K Followers

337 Following

Scott Brown, CMT (@scottcharts) 's Twitter Profile Photo

This is just the second-most bullish stat I've got for subscribers in tomorrow's Monday Morning Playbook. Subscribe now to get tomorrow's report and get 20% off your first year using the link below browninsights.com/d3c0ce4c

Scott Brown, CMT (@scottcharts) 's Twitter Profile Photo

The 10.76 point drop in the VIX from Friday’s high is the biggest two-day high-to-close decline since April of this year. Before that, it was August 2024 (after the yen carry crisis fears abated) and before that June of 2020 and March 2020. Were those good times to invest?

The 10.76 point drop in the VIX from Friday’s high is the biggest two-day high-to-close decline since April of this year. Before that, it was August 2024 (after the yen carry crisis fears abated) and before that June of 2020 and March 2020. 

Were those good times to invest?
Scott Brown, CMT (@scottcharts) 's Twitter Profile Photo

So far, an ugly post-earnings reaction for Vertiv, which opened near all-time highs. Now down more than 5% and breaking to a two-week low.

So far, an ugly post-earnings reaction for Vertiv, which opened near all-time highs. 

Now down more than 5% and breaking to a two-week low.
Scott Brown, CMT (@scottcharts) 's Twitter Profile Photo

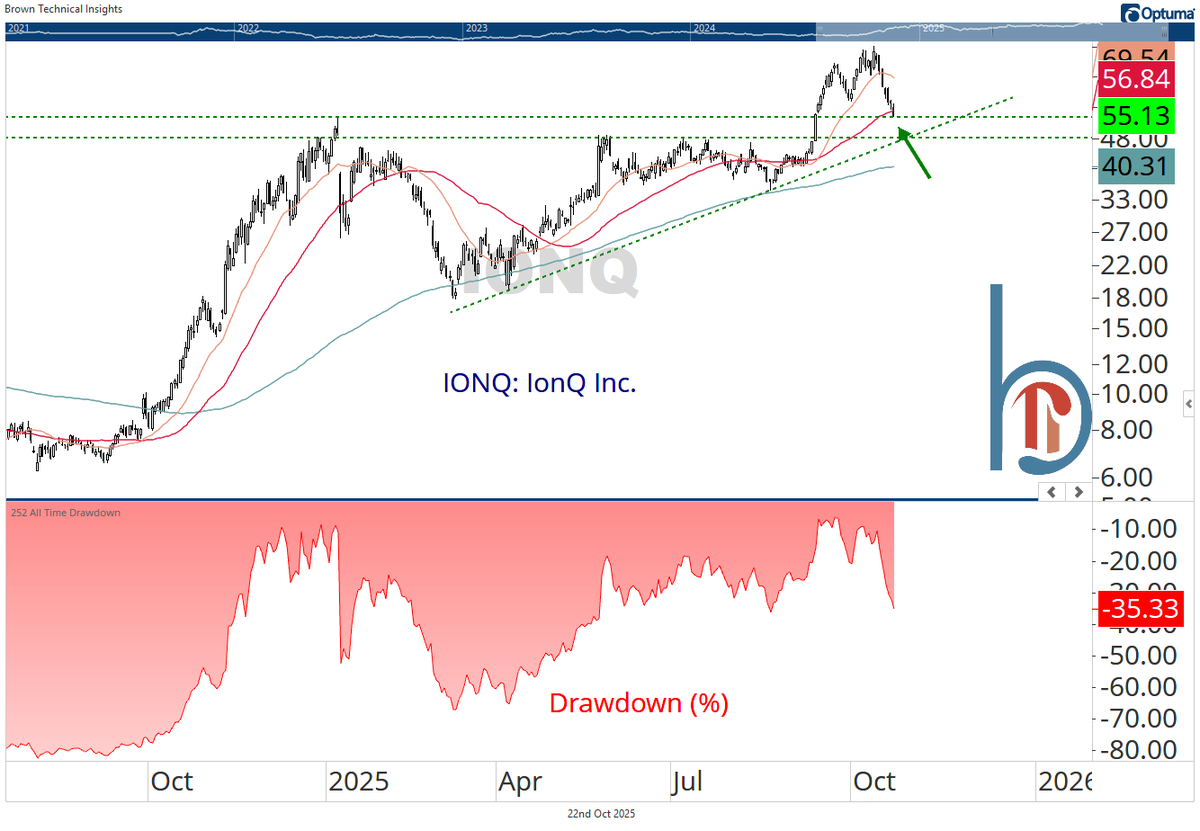
Has the quantum bubble burst, or is this normal corrective action for an insanely volatile group? We may be about to find out. (#2 holding in IWM btw)

Has the quantum bubble burst, or is this normal corrective action for an insanely volatile group?

We may be about to find out.

(#2 holding in IWM btw)
Scott Brown, CMT (@scottcharts) 's Twitter Profile Photo

Happy Birthday to Ryan Detrick, CMT! Nobody has been more helpful or influential to my career and it’s fitting that we’re tracking to another positive day for stocks!

Scott Brown, CMT (@scottcharts) 's Twitter Profile Photo

Not a great place to see weakness from financials (equally-weighted). Already at 52-weeks lows vs. SPX and YTD lows vs. the equal-weight index

Not a great place to see weakness from financials (equally-weighted).

Already at 52-weeks lows vs. SPX and YTD lows vs. the equal-weight index
Scott Brown, CMT (@scottcharts) 's Twitter Profile Photo

One of the most bullish charts out there: Crude oil upside down. Today's 3.5% drop seems to be aiding the consumer discretionary sector

One of the most bullish charts out there: Crude oil upside down.

Today's 3.5% drop seems to be aiding the consumer discretionary sector