George Railean (@george_railean) 's Twitter Profile
George Railean

@george_railean

Experienced #UX/#UI & #Graphic #Designer. Creative focused on #Dashboard #Interface design. facebook.com/G.Railean/
🏀dribbble.com/georai

ID: 2936694718

linkhttp://georgerailean.com calendar_today22-12-2014 08:33:39

690 Tweet

733 Takipçi

765 Takip Edilen

George Railean (@george_railean) 's Twitter Profile Photo

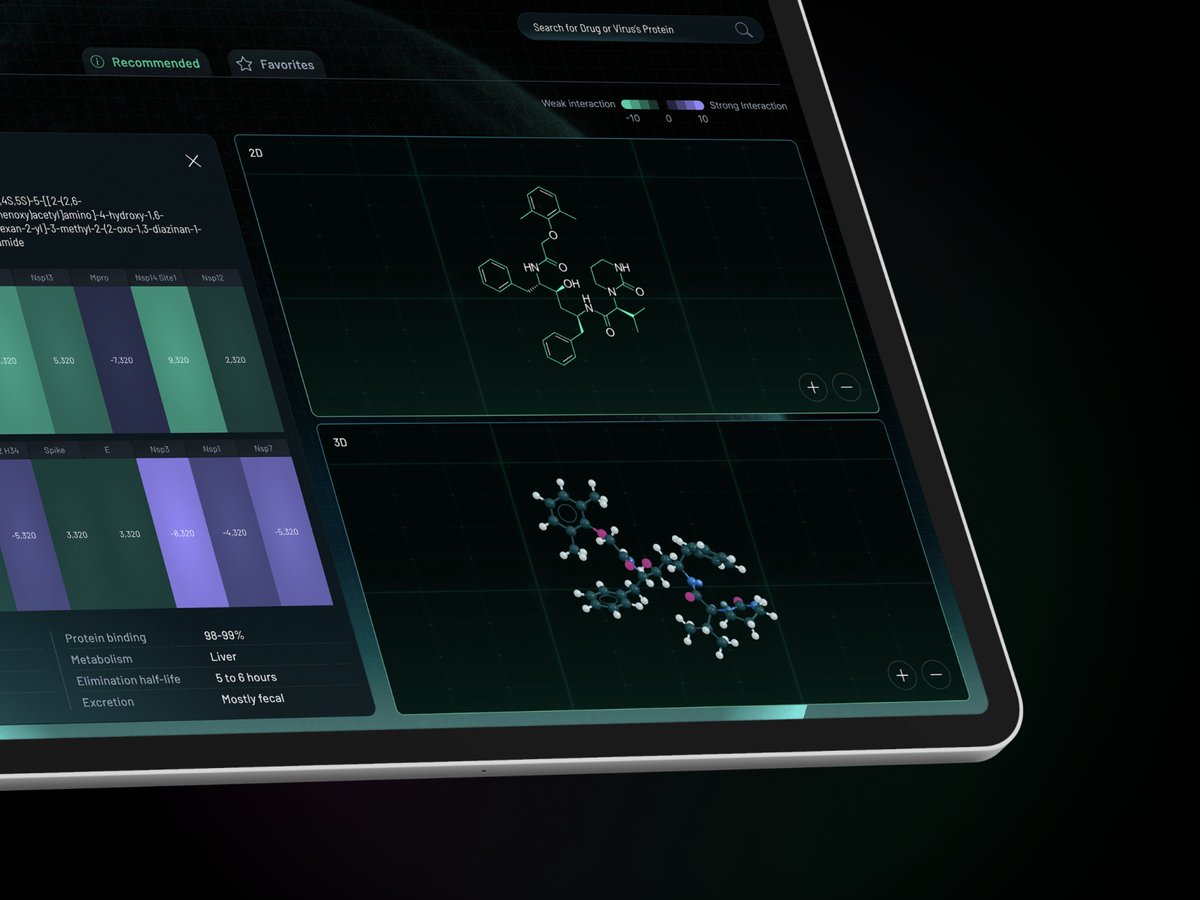
In the pursuit of effective SARS-CoV-2 therapies, understanding the molecular interactions of antiviral drugs is critical. For this case study, the Qgen Lab interface begins by showcasing a 3D model of Lopinavir, a key antiviral drug. #healthcaredesign #uxui #PatientCare

George Railean (@george_railean) 's Twitter Profile Photo

Unlocking Precision Cancer Treatment with QGen Health Lab Lung cancer continues to be a global health crisis. QGen Health Lab tackles this challenge by empowering researchers with an AI-powered platform for exploring complex relationships between drugs, proteins, and genes.

George Railean (@george_railean) 's Twitter Profile Photo

How can automation management be made effortless? Our design of the "Robodog" dashboard turns complex operations into a seamless experience. We developed a sleek, user-friendly interface that makes it easy for operators to visualize and control robotic vehicles in real-time.

George Railean (@george_railean) 's Twitter Profile Photo

The Qgen's Lab intuitive design simplifies complex molecular data, empowering researchers and clinicians to explore key interactions effortlessly and gain a thorough understanding of how various molecules might interact with other compounds in therapeutic contexts.

The Qgen's Lab intuitive design simplifies complex molecular data, empowering researchers and clinicians to explore key interactions effortlessly and gain a thorough understanding of how various molecules might interact with other compounds in therapeutic contexts.
George Railean (@george_railean) 's Twitter Profile Photo

Meet the "Robodog" dashboard - a smart solution for seamless automation management in your production environment. Instantly monitor AGV status, from battery life to mission progress, ensuring optimal performance and minimizing downtime. #automation #manufacturing

George Railean (@george_railean) 's Twitter Profile Photo

The "Robodog" dashboard offers a live map of the warehouse layout, pinpointing the precise positions and routes of each AGV. #healthcaredesign #uxui #patientcare #medicalinnovation #userexperience

The "Robodog" dashboard offers a live map of the warehouse layout, pinpointing the precise positions and routes of each AGV. 
#healthcaredesign #uxui #patientcare #medicalinnovation #userexperience
George Railean (@george_railean) 's Twitter Profile Photo

The "Robodog" dashboard is designed to give you total control over your warehouse logistics. With live camera feeds, real-time mission updates, and intuitive joystick control, operators can easily navigate AGVs for manual tasks when precision is critical.

George Railean (@george_railean) 's Twitter Profile Photo

At Fuselab Creative, we design dynamic dashboards that bring clarity and control to your operations. Our Robodog dashboard offers a 3D map of your production warehouse, giving you a real-time view of AGV positions, routes, and mission stops.

George Railean (@george_railean) 's Twitter Profile Photo

The Robodog AGV dashboard provides a streamlined user experience, allowing operators to easily move vehicle cards between missions, facilitating quick reassignments of AGVs as warehouse demands change. #warehouseautomation #uxuidesign

George Railean (@george_railean) 's Twitter Profile Photo

The primary purpose of Syncatlas is to empower users - researchers, health professionals, and strategic planners - with a robust tool for understanding the relationships and interactions within the global health sector. #healthcareinnovation #globalhealth #healthcareux

The primary purpose of Syncatlas is to empower users - researchers, health professionals, and strategic planners - with a robust tool for understanding the relationships and interactions within the global health sector.
#healthcareinnovation #globalhealth #healthcareux
George Railean (@george_railean) 's Twitter Profile Photo

Our real estate dashboard redefines property browsing, with a fully rotatable 3-D model, users can explore the architecture and layout in detail, moving beyond basic images. The interactive map overlays vital neighborhood data - schools, hospitals, dining spots, and more...

Our real estate dashboard redefines property browsing, with a fully rotatable 3-D model, users can explore the architecture and layout in detail, moving beyond basic images. The interactive map overlays vital neighborhood data - schools, hospitals, dining spots, and more...
George Railean (@george_railean) 's Twitter Profile Photo

RealFinder transforms real estate analysis with its cutting-edge visualization tools. The dashboard combines real-time market statistics, such as pricing trends and property availability, with intuitive visuals like a housing market overview and property type breakdown.

George Railean (@george_railean) 's Twitter Profile Photo

RealFinder is a powerful tool for property analysis, combining key metrics like rental occupancy, population, and property value trends. The distribution pie chart highlights property types, while the "Housing market overview" tracks activity month-by-month. #realestate

RealFinder is a powerful tool for property analysis, combining key metrics like rental occupancy, population, and property value trends. The distribution pie chart highlights property types, while the "Housing market overview" tracks activity month-by-month. #realestate
George Railean (@george_railean) 's Twitter Profile Photo

Our dashboard presents live metrics on energy consumption, spend, and production, allowing businesses to make informed decisions. With the Energy Intensity Index, users can track energy efficiency in kWh/sqft MT, providing insights to optimize usage.

Our dashboard presents live metrics on energy consumption, spend, and production, allowing businesses to make informed decisions. With the Energy Intensity Index, users can track energy efficiency in kWh/sqft MT, providing insights to optimize usage.
George Railean (@george_railean) 's Twitter Profile Photo

The Energy Sector Dashboard brings real-time energy management to life, seamlessly blending IoT technology with interactive visualizations for a fully engaging experience.

The Energy Sector Dashboard brings real-time energy management to life, seamlessly blending IoT technology with interactive visualizations for a fully engaging experience.
George Railean (@george_railean) 's Twitter Profile Photo

What if you could visualize your entire energy consumption in real-time, pinpointing exactly where energy is used and from which sources? The Energy Consumption Dashboard is not just a tool - it's a strategic asset.

George Railean (@george_railean) 's Twitter Profile Photo

The Energy Consumption Dashboard captures this relationship by integrating real-time weather data, allowing businesses to understand how changes in wind speed, cloud cover, and other atmospheric variables affect their energy production.

George Railean (@george_railean) 's Twitter Profile Photo

Meet the Energy Consumption Dashboard - the smart way to manage energy consumption across regions. This powerful, interactive tool offers real-time data from solar, wind, and thermal energy sources, making it easy to track energy production and consumption.

Meet the Energy Consumption Dashboard - the smart way to manage energy consumption across regions. This powerful, interactive tool offers real-time data from solar, wind, and thermal energy sources, making it easy to track energy production and consumption.
George Railean (@george_railean) 's Twitter Profile Photo

Presenting energy data intuitively, and interactively allows businesses and governments to make quicker, more informed decisions. The Energy Tension and Load Distribution feature monitors and analyzes energy load across regions and routes in real time.

George Railean (@george_railean) 's Twitter Profile Photo

The Energy Consumption Dashboard with weather simulation is set to change the landscape for businesses, allowing them to see how factors like wind speed and sunlight directly influence renewable energy production #energyconsumption #ux