Kimly (@scottkimly) 's Twitter Profile
Kimly

@scottkimly

Tableau Visionary & Ambassador | 18x #VOTD | 3x Runner-up WIA DataViz | 2x Vizzies Winner | #Ironviz Finalist '22 | @DiversityinData | #MomsWhoViz | #VeryAsian

ID: 1022145275891044352

linkhttp://shewillviz.com calendar_today25-07-2018 15:43:19

3,3K Tweet

1,1K Followers

1,1K Following

Tableau Public (@tableaupublic) 's Twitter Profile Photo

15 years. 11 million vizzes created. 5 million people exploring data. Countless moments of insights and inspiration. Here’s to the power of sharing data with the world! public.tableau.com

Tableau (@tableau) 's Twitter Profile Photo

Join Tableau's community team as they share an inside look at Tableau Conference #TC25. Connect with the #DataFam for all the tips to know before you go—so you can plan your perfect week at TC. Save your spot for the DataFam Discovery Tableau User Group: tabsoft.co/41UhAvt

Join Tableau's community team as they share an inside look at Tableau Conference #TC25.

Connect with the #DataFam for all the tips to know before you go—so you can plan your perfect week at TC.

Save your spot for the DataFam Discovery Tableau User Group: tabsoft.co/41UhAvt
Kevin Flerlage (@flerlagekev) 's Twitter Profile Photo

With the announcement of the New, Returning, and New Hall of Fame @Tableau Visionaries, I've updated my Visionaries Collector's Edition viz. Check it out: Link: public.tableau.com/app/profile/ke…

With the announcement of the New, Returning, and New Hall of Fame @Tableau Visionaries, I've updated my Visionaries Collector's Edition viz. Check it out:

Link: public.tableau.com/app/profile/ke…
Tableau Public (@tableaupublic) 's Twitter Profile Photo

This #VizOfTheDay by Daisy Jones uses a Sankey chord diagram to visualize the flavors used by the final three contestants in the ultimate baking battle. tabsoft.co/4iCCrZU

This #VizOfTheDay by <a href="/Jones_DataJones/">Daisy Jones</a> uses a Sankey chord diagram to visualize the flavors used by the final three contestants in the ultimate baking battle.

tabsoft.co/4iCCrZU
Tableau (@tableau) 's Twitter Profile Photo

The Flerlage twins are taking the main stage at #TC25! 🎤 Grab your seat at this must-see super session at Tableau Conference: How to Do Cool Stuff in Tableau with Ken Flerlage and Kevin Flerlage. Don't miss out: tabsoft.co/4kKvLe1

The Flerlage twins are taking the main stage at #TC25! 🎤

Grab your seat at this must-see super session at Tableau Conference: How to Do Cool Stuff in Tableau with <a href="/flerlagekr/">Ken Flerlage</a> and <a href="/FlerlageKev/">Kevin Flerlage</a>.

Don't miss out: tabsoft.co/4kKvLe1
Jennifer Dawes (@jreevers5) 's Twitter Profile Photo

Who else is getting excited for Tableau conference? Dinushki De Livera and I will be back and sharing the stage to host the Tableau Tip Battle. This year is a Luau theme and we have an incredible line-up of tipsters. Introducing the first 4... Tableau Visionaries, Felicia Styer,

Who else is getting excited for <a href="/tableau/">Tableau</a> conference? <a href="/deeVizable/">Dinushki De Livera</a> and I will be back and sharing the stage to host the Tableau Tip Battle. This year is a Luau theme and we have an incredible line-up of tipsters. 

Introducing the first 4... 

Tableau Visionaries, <a href="/graph_hopper/">Felicia Styer</a>,
Victory Omovrah (@vizwithvictory) 's Twitter Profile Photo

Long time, no viz! I got overwhelmed over the past few weeks and couldn’t bring myself to work on a visualization. But I’m back, and I’m excited to share my Social Media Analytics Dashboard! This is also my submission for Advanced Visualization.....

Jennifer Dawes (@jreevers5) 's Twitter Profile Photo

Who else will be taking to the stage you?? The final four tipsters are... Tableau Visionary Hall of Famers Jeffrey Shaffer, Jonathan Drummey, Lorna Brown, and Sarah Bartlett I can't wait to see the amazing tips!!! #TC25 #datafam

Who else will be taking to the stage you?? 

The final four tipsters are...

Tableau Visionary Hall of Famers <a href="/DataPlusScience/">Jeffrey Shaffer</a>, <a href="/jonathandrummey/">Jonathan Drummey</a>, <a href="/_Lorna_Brown/">Lorna Brown</a>, and <a href="/sarahlovesdata/">Sarah Bartlett</a> 

I can't wait to see the amazing tips!!!

#TC25 #datafam
Heather Cox (@hthr_cox) 's Twitter Profile Photo

I've published a new viz, looking at the diagnosis journey for autistic adults. Ken Flerlage 's curved timeline guide was a huge help in bringing my idea to life, but boy was there a lot of extra math to tip it on an angle! public.tableau.com/app/profile/he…

Tableau Public (@tableaupublic) 's Twitter Profile Photo

This #VizOfTheDay created during the 2025 #IronViz competition by finalist Kathryn McCrindle explores data from wildlife strikes. Kathryn uses map layers and features line and bar charts, maps and more. tabsoft.co/3GkCvzF

This #VizOfTheDay created during the 2025 #IronViz competition by finalist <a href="/katmccrind/">Kathryn McCrindle</a> explores data from wildlife strikes. Kathryn uses map layers and features line and bar charts, maps and more. 

tabsoft.co/3GkCvzF
Eric Balash (@readysetdata) 's Twitter Profile Photo

🚨 Week 7 of #B2VB is live! This week we’re building a histogram using fake data on teen screen time created with Data Mockstar by Adam Mico! Challenge details: bit.ly/42mbaFO #DataChallenge #Tableau #PowerBI

Kimly (@scottkimly) 's Twitter Profile Photo

#TC25 and all that. I didn't take many photos (because I'm lazy) but as this will probably be my last conference for awhile, I'm so grateful for the conversations had, and connections made. Love ya #datafam ♥️♥️

ZACH (@zachbowders) 's Twitter Profile Photo

This week Data + Love is Victorious, pulling in a fun conversation with Tableau Ambassador Victory Omovrah about Inspiration, Passion, and Viz Basics open.spotify.com/episode/1PasT9…

This week Data + Love is Victorious, pulling in a fun conversation with Tableau Ambassador Victory Omovrah about Inspiration, Passion, and Viz Basics

open.spotify.com/episode/1PasT9…
Victory Omovrah (@vizwithvictory) 's Twitter Profile Photo

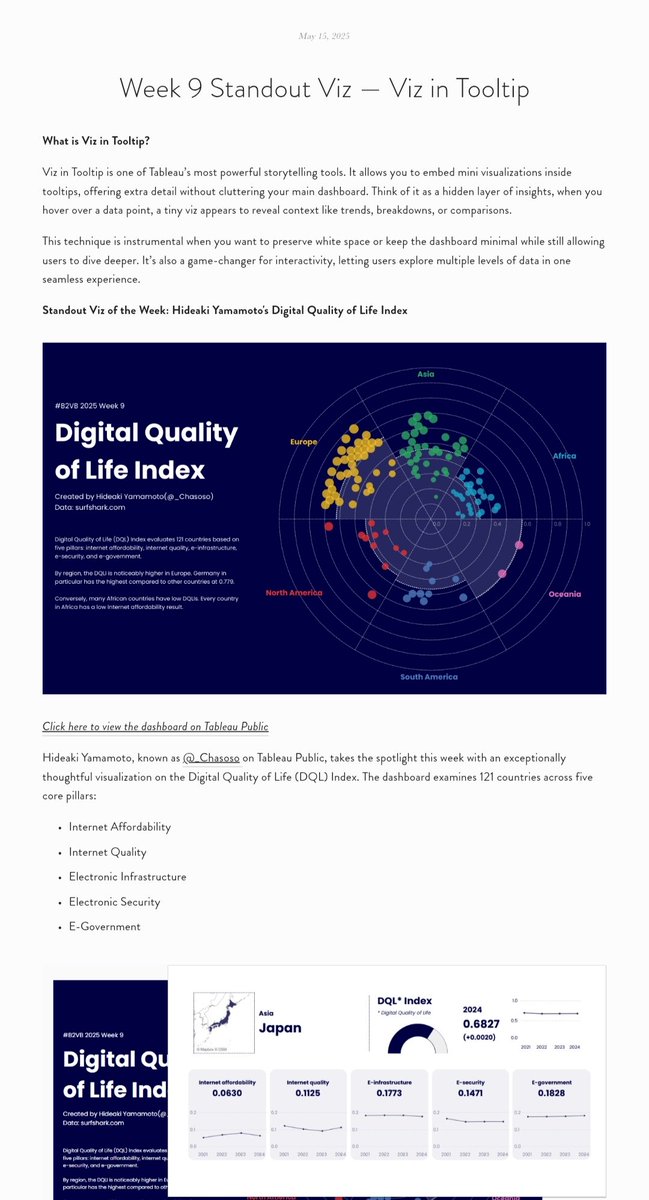
Just launched a new weekly blog series: Beyond Basic Blog! Every week, I spotlight a standout viz from the #B2VB challenge - breaking down why it works, the design choices, and cool features. 🔗 Read Week 9: thetableaustudentguide.com/back-2-viz-bas… #DataFam #Tableau #DataViz #VizInTooltip

Just launched a new weekly blog series: Beyond Basic Blog!

Every week, I spotlight a standout viz from the #B2VB challenge - breaking down why it works, the design choices, and cool features.

🔗 Read Week 9: thetableaustudentguide.com/back-2-viz-bas…
#DataFam #Tableau #DataViz #VizInTooltip
DataConnect Conference (@dataconnectconf) 's Twitter Profile Photo

🚨 Final call! Today’s your last chance to secure your spot at DCCWest. Don’t miss this opportunity to connect with experts and peers at the forefront of AI and analytics. When: May 20, 2025 (Doors open at 7:00 AM) Where: San Francisco, CA Registration closes tonight!

🚨 Final call! Today’s your last chance to secure your spot at DCCWest.
Don’t miss this opportunity to connect with experts and peers at the forefront of AI and analytics. 

When: May 20, 2025 (Doors open at 7:00 AM)
Where: San Francisco, CA

Registration closes tonight!
Bo McCready (@boknowsdata) 's Twitter Profile Photo

New blog! 📊 Color is one of the most obvious parts of a #dataviz project, and for #IronViz, it was one of the many things I obsessed over! In this blog, I share how I thought about contrast, colorblindness, + the meaning of colors. boknowsdata.com/articles/inten… #datafam #tableau

Tableau Public (@tableaupublic) 's Twitter Profile Photo

Try spiraling satellite charts with this #VizOfTheDay by Sam Parsons—an alternative to visualizing pie and doughnut charts when percentages exceed 100%. tabsoft.co/4drM1gX
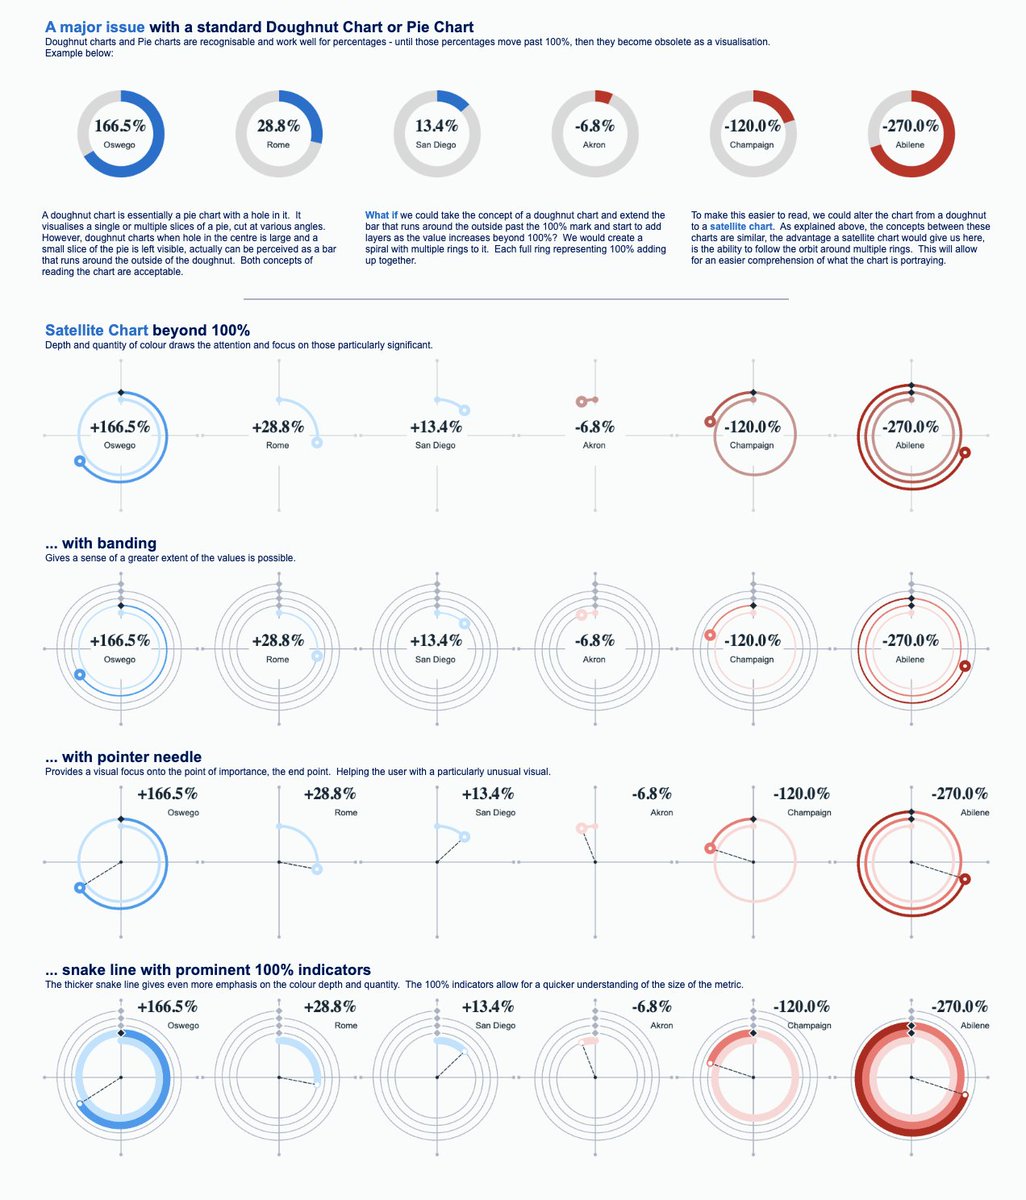
Try spiraling satellite charts with this #VizOfTheDay by <a href="/SParsonsDataViz/">Sam Parsons</a>—an alternative to visualizing pie and doughnut charts when percentages exceed 100%. tabsoft.co/4drM1gX