Harvey Domingo (@physiostats) 's Twitter Profile
Harvey Domingo

@physiostats

Health & Safety ▪️Physiotherapist▪️He•Him 🌈🫰🏻▪️Someone's 자기야 ▪️ My tweets, my own views

ID: 918323585726300160

calendar_today12-10-2017 03:52:59

326 Tweet

126 Followers

552 Following

SER Publications (@epipubs) 's Twitter Profile Photo

‘Confoundr’ software can be used to help diagnose confounding & selection bias with time-varying exposures. Schnellinger et al. (2020) explain how: doi.org/10.1093/aje/kw… ✅Am J Epidemiology

‘Confoundr’ software can be used to help diagnose confounding &amp; selection bias with time-varying exposures. Schnellinger et al. (2020) explain how: doi.org/10.1093/aje/kw… ✅<a href="/AmJEpi/">Am J Epidemiology</a>
University of the Philippines (@upsystem) 's Twitter Profile Photo

Due to COVID-19, University Councils across the UP System unanimously decided not to hold the UPCAT for admission of students in AY 2021-22. Instead, the UP Office of Admissions is currently modifying the admissions system for the next intake year. Read: up.edu.ph/no-upcat-2021-…

Due to COVID-19, University Councils across the UP System unanimously decided not to hold the UPCAT for admission of students in AY 2021-22. Instead, the UP Office of Admissions is currently modifying the admissions system for the next intake year.

Read: up.edu.ph/no-upcat-2021-…
University of the Philippines (@upsystem) 's Twitter Profile Photo

UP will begin accepting applications for first-year students for AY 2021-2022 on 7 January 2021, via an online portal especially for admissions applications. Read more: up.edu.ph/up-to-start-ac…

UP will begin accepting applications for first-year students for AY 2021-2022 on 7 January 2021, via an online portal especially for admissions applications.  

Read more: up.edu.ph/up-to-start-ac…
Kareem Carr, Statistics Person (@kareem_carr) 's Twitter Profile Photo

Some people follow me for my statistics insights. Other people like me for my social commentary. This thread explains how those things are related. 👇

Some people follow me for my statistics insights. Other people like me for my social commentary. This thread explains how those things are related. 👇
Philippine Statistics Authority (@psagovph) 's Twitter Profile Photo

1. Ischaemic Heart Disease 2. Neoplasm (commonly known as cancer) 3. Cerebrovascular Diseases 4. Diabetes Mellitus 5. Hypertensive Diseases 6. Remainder of Diseases of the Genitourinary System

1. Ischaemic Heart Disease
2. Neoplasm (commonly known as cancer)
3. Cerebrovascular Diseases
4. Diabetes Mellitus
5. Hypertensive Diseases
6. Remainder of Diseases of the Genitourinary System
Harvey Domingo (@physiostats) 's Twitter Profile Photo

Not really my first year in teaching but as one of the most junior in the college, I must say I’m still in the path of finding my marigold. Find Your Marigold: The One Essential Rule for New Teachers | Cult of Pedagogy cultofpedagogy.com/marigolds/

Prof Lennart Nacke, PhD (@acagamic) 's Twitter Profile Photo

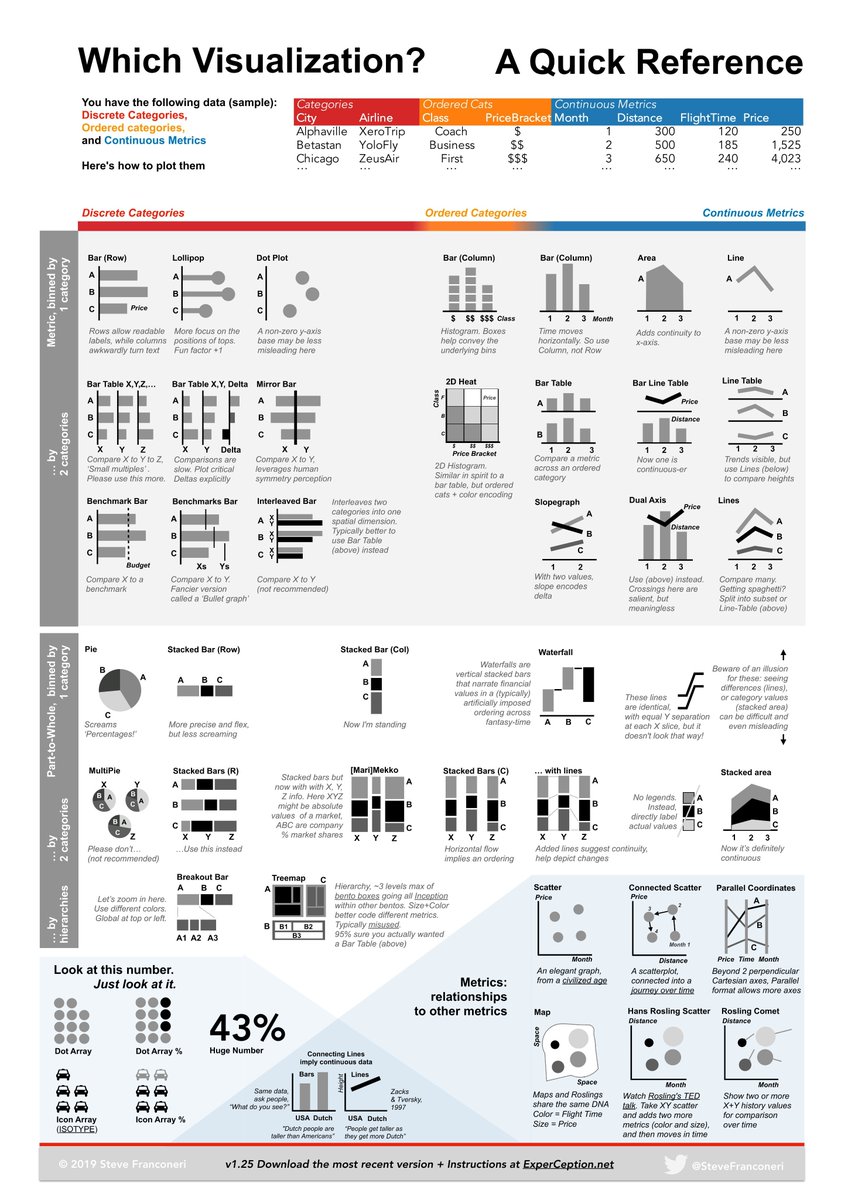
3 data types that can power your next data visualization Most people struggle with how to plot their data. But if you know your data type, the process becomes easy. How to visualize your data (by Steve Franconeri):

3 data types that can power your next data visualization

Most people struggle with how to plot their data.

But if you know your data type, the process becomes easy.

How to visualize your data (by Steve Franconeri):
Joachim Schork (@joachimschork) 's Twitter Profile Photo

If you're still using raw R outputs for presentations, it's time for an upgrade! Tools like gtsummary bring your statistical results to life, making them much more digestible for non-technical audiences. While base R functions like summary(fit) work well for statisticians, they

If you're still using raw R outputs for presentations, it's time for an upgrade! Tools like gtsummary bring your statistical results to life, making them much more digestible for non-technical audiences.

While base R functions like summary(fit) work well for statisticians, they
Donald McKnight (@donaldmcknight2) 's Twitter Profile Photo

The informal poll results are in, & as I feared, most people are running ANOVAs in #R with functions that can give highly misleading (or flat out wrong) results. Follow along to see why using anova() and aov() is usually inadvisable & why you should be using car::Anova() 🧵

The informal poll results are in, &amp; as I feared, most people are running ANOVAs in #R with functions that can give highly misleading (or flat out wrong) results. Follow along to see why using anova() and aov() is usually inadvisable &amp; why you should be using car::Anova() 🧵
Joachim Schork (@joachimschork) 's Twitter Profile Photo

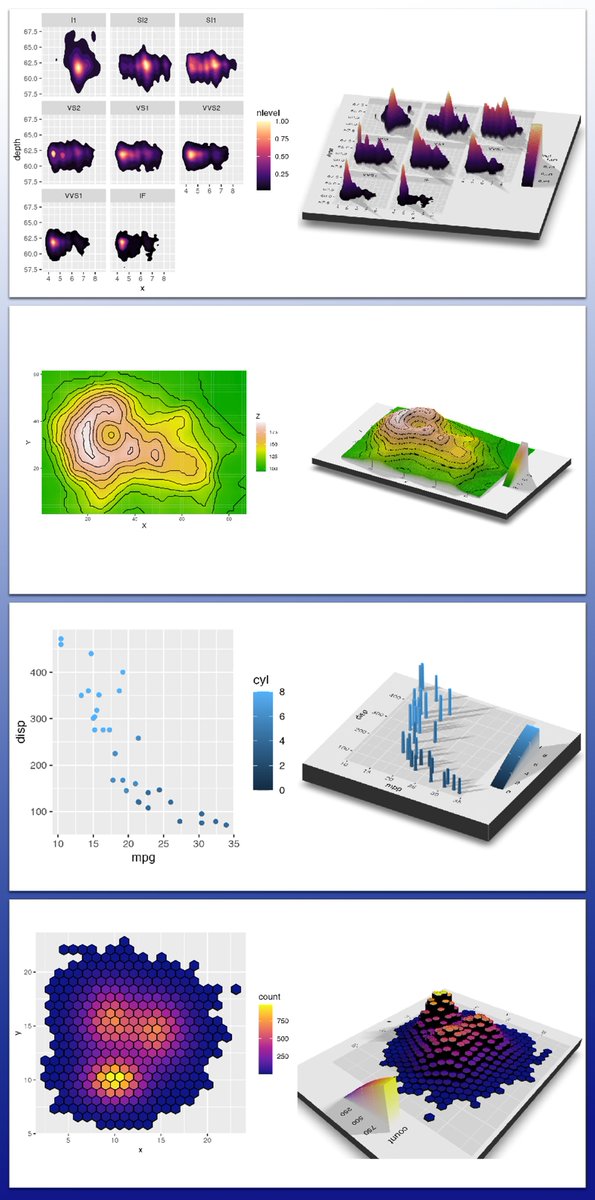
Bring your ggplot2 visualizations into 3D with rayshader! This extension adds powerful 3D plotting capabilities to R, making it easy to transform standard visuals into interactive and visually engaging data representations. With rayshader, you can: ✔️ Add Interactive 3D Effects

Bring your ggplot2 visualizations into 3D with rayshader! This extension adds powerful 3D plotting capabilities to R, making it easy to transform standard visuals into interactive and visually engaging data representations.

With rayshader, you can:

✔️ Add Interactive 3D Effects
Joachim Schork (@joachimschork) 's Twitter Profile Photo

When building predictive models, overfitting is a common challenge. Shrinkage methods, such as Ridge Regression, Lasso, and Elastic Net, help address this by adding a penalty term to the objective function during training, which discourages large coefficients. This results in

When building predictive models, overfitting is a common challenge. Shrinkage methods, such as Ridge Regression, Lasso, and Elastic Net, help address this by adding a penalty term to the objective function during training, which discourages large coefficients. This results in