Niccolo Conte (@niccoloc) 's Twitter Profile
Niccolo Conte

@niccoloc

Content strategy and editor at @Visualcap. Markets/economy focus.

ID: 271476887

linkhttps://www.visualcapitalist.com calendar_today24-03-2011 15:50:02

408 Tweet

359 Followers

2,2K Following

Visual Capitalist (@visualcap) 's Twitter Profile Photo

The 2025 Global Forecast Report, presented by Inigo, is now available on VC+ 🔮 Stay informed about the key trends for the year ahead with easily digestible visuals based on 800+ expert predictions. Join VC+ to access the exclusive report: visualcapitalist.com/vcplus

The 2025 Global Forecast Report, presented by <a href="/Inigo_Insurance/">Inigo</a>, is now available on VC+ 🔮

Stay informed about the key trends for the year ahead with easily digestible visuals based on 800+ expert predictions.

Join VC+ to access the exclusive report: visualcapitalist.com/vcplus
Visual Capitalist (@visualcap) 's Twitter Profile Photo

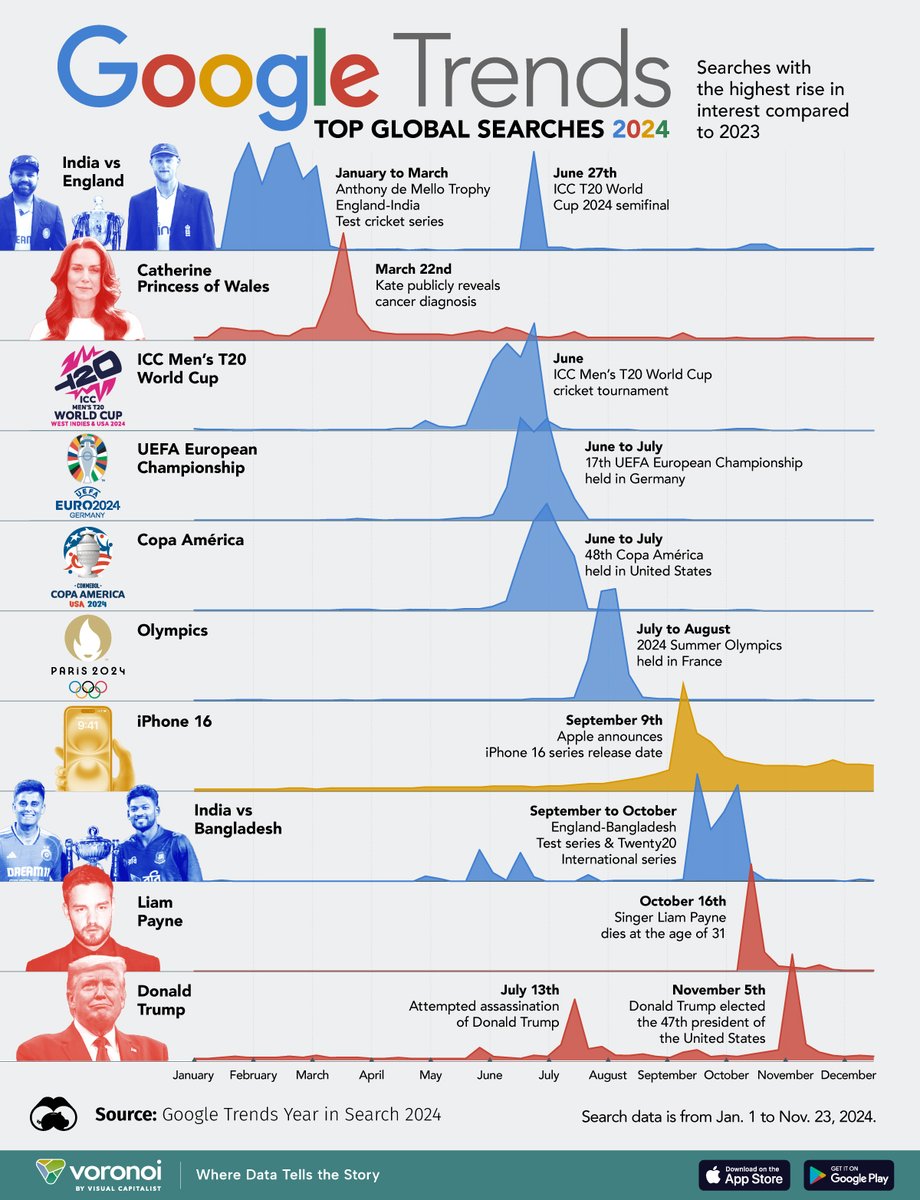
Visualizing What the World Googled in 2024 🔍️ 🔔 Looking for more insights like this? Stay ahead with visualizations tailored to your interests on the Voronoi. voronoiapp.com/other/Top-Tren…

Visualizing What the World Googled in 2024 🔍️

🔔 Looking for more insights like this? Stay ahead with visualizations tailored to your interests on the <a href="/VoronoiApp/">Voronoi</a>. 

voronoiapp.com/other/Top-Tren…
Visual Capitalist (@visualcap) 's Twitter Profile Photo

What are the potential scenarios for the U.S. economy this year? 📉 Our 2025 Global Forecast Series, presented by Inigo, summarizes 800+ expert predictions into easily digestible visualizations. Join VC+ to access the full report: visualcapitalist.com/vcplus

What are the potential scenarios for the U.S. economy this year? 📉

Our 2025 Global Forecast Series, presented by <a href="/Inigo_Insurance/">Inigo</a>, summarizes 800+ expert predictions into easily digestible visualizations.

Join VC+ to access the full report: visualcapitalist.com/vcplus
Niccolo Conte (@niccoloc) 's Twitter Profile Photo

Be the yield you want to see in the world... or something like that. At least Luna/Anchor had a fancy rube-goldberg machine-like explanation for Anchor yield to try and confuse people just enough into thinking it's run by smart people.

Voronoi (@voronoiapp) 's Twitter Profile Photo

Elon Musk Thanks for sharing our visualization!📊We dive deeper into the factors behind the global debt surge of over $100 trillion in the past decade here: voronoiapp.com/debt/Global-De…

Visual Capitalist (@visualcap) 's Twitter Profile Photo

What geopolitical risks on the horizon might shape 2025? 🌍 Our 2025 Global Forecast Series, presented by Inigo, explores global tensions like the Russia-Ukraine conflict, Middle East dynamics, and Trump's presidency. Join VC+ to access the report:

What geopolitical risks on the horizon might shape 2025? 🌍

Our 2025 Global Forecast Series, presented by <a href="/Inigo_Insurance/">Inigo</a>, explores global tensions like the Russia-Ukraine conflict, Middle East dynamics, and Trump's presidency.

Join VC+ to access the report:
Visual Capitalist (@visualcap) 's Twitter Profile Photo

Prediction Consensus: What Experts Are Watching for 2025 🔮 Looking for more digestible visuals with key insights for the year ahead? Get our 50-page report on the most cited trends in the economy, markets, geopolitics, and tech: store.visualcapitalist.com/2025-global-fo…

Prediction Consensus: What Experts Are Watching for 2025 🔮

Looking for more digestible visuals with key insights for the year ahead? Get our 50-page report on the most cited trends in the economy, markets, geopolitics, and tech: store.visualcapitalist.com/2025-global-fo…
Niccolo Conte (@niccoloc) 's Twitter Profile Photo

Took my brain way too long to realize this was just a simple line chart. Don't think I've ever seen someone put a 3D object on a 2D line chart like this.. for good reason.

Took my brain way too long to realize this was just a simple line chart.

Don't think I've ever seen someone put a 3D object on a 2D line chart like this.. for good reason.
Visual Capitalist (@visualcap) 's Twitter Profile Photo

How the U.S. Dollar Has Performed, by President (1967-2025) 💵 📲 Want more content like this with daily insights from the world’s top creators? ⁠See it first on the Voronoi. voronoiapp.com/economy/The-US…

How the U.S. Dollar Has Performed, by President (1967-2025) 💵

📲 Want more content like this with daily insights from the world’s top creators? ⁠See it first on the <a href="/VoronoiApp/">Voronoi</a>.

voronoiapp.com/economy/The-US…
Niccolo Conte (@niccoloc) 's Twitter Profile Photo

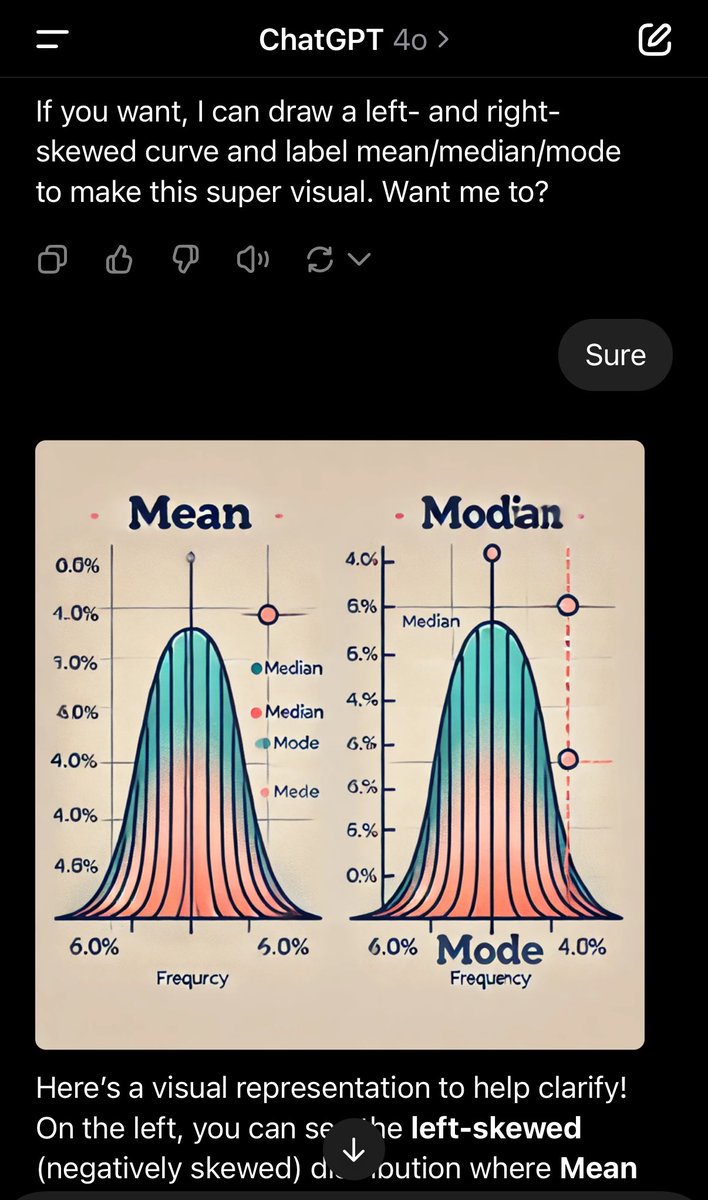
Highly ambitious effort of ChatGPT to try and draw a left and right skewed distribution. When it offered I thought it would use python and make a chart, but nope, went for the image gen.

Highly ambitious effort of ChatGPT to try and draw a left and right skewed distribution. 

When it offered I thought it would use python and make a chart, but nope, went for the image gen.
Balaji (@balajis) 's Twitter Profile Photo

Most countries are small countries. More than 50% have <10M people. Almost 20% have <1M people. We've built social networks much bigger than that.

Most countries are small countries.
More than 50% have &lt;10M people.
Almost 20% have &lt;1M people.
We've built social networks much bigger than that.