Matthew Miskin, CFA (@matthew_miskin) 's Twitter Profile
Matthew Miskin, CFA

@matthew_miskin

Co-Chief Investment Strategist @JH_investments. Connecting the dots to formulate views across markets. Disclosure: bit.ly/2USIeSZ

ID: 1196862474

linkhttps://bit.ly/3qKjkl8 calendar_today19-02-2013 12:05:26

3,3K Tweet

4,4K Followers

383 Following

Matthew Miskin, CFA (@matthew_miskin) 's Twitter Profile Photo

Shelter by far the largest driver of #CPI with another 0.3% m/m increase, without that this report would suggest deflation. The #Fed cut 4 times last year with over 3% #inflation, now it is sitting under 3% & the bond market can't get believe there will be over 2 cuts. 🤔

Shelter by far the largest driver of #CPI with another 0.3% m/m increase, without that this report would suggest deflation. 

The #Fed cut 4 times last year with over 3% #inflation, now it is sitting under 3% & the bond market can't get believe there will be over 2 cuts. 🤔
Matthew Miskin, CFA (@matthew_miskin) 's Twitter Profile Photo

The negative momentum in the #USD has been of the most powerful multi-asset drivers in 2025. The #DXY index is already down -9.5% this year. May not be able to wring out too much more juice from the falling U.S. dollar trade with consensus this far to one side.

RenMac: Renaissance Macro Research (@renmacllc) 's Twitter Profile Photo

Rental disinflation ahead? Zillow's Observed Rent Index continues to ease, rising 1.9% SAAR in May and up just 2.3% SAAR over the last three months. More widely followed measures like OER and primary rents have room to decelerate over the summer.

Rental disinflation ahead? Zillow's Observed Rent Index continues to ease, rising 1.9% SAAR in May and up just 2.3% SAAR over the last three months. More widely followed measures like OER and primary rents have room to decelerate over the summer.
Matthew Miskin, CFA (@matthew_miskin) 's Twitter Profile Photo

Updated NAHB 🏠 housing market index fell again into June. "The latest survey revealed that 37% of builders reported cutting prices in June, the highest percentage since 2022. The average price reduction was 5%." #housingmarket Oxford Economics chart.

Updated <a href="/NAHBhome/">NAHB 🏠</a> housing market index fell again into June.

"The latest survey revealed that 37% of builders reported cutting prices in June, the highest percentage since 2022. The average price reduction was 5%."

#housingmarket <a href="/OxfordEconomics/">Oxford Economics</a> chart.
Charlie Bilello (@charliebilello) 's Twitter Profile Photo

The supply of new homes in the US moved up to 9.8 months in May, highest since 2022. Prior to 2022, when supply was this high the US economy was always in recession & facing job losses. Today, the supply spike (thus far) is due to the least affordable housing market in history.

The supply of new homes in the US moved up to 9.8 months in May, highest since 2022. Prior to 2022, when supply was this high the US economy was always in recession &amp; facing job losses. Today, the supply spike (thus far) is due to the least affordable housing market in history.
Truflation (@truflation) 's Twitter Profile Photo

US Inflation: 1.66% 🇺🇸 There was a 0.6 percentage point drop in the last 9 days. Do you believe inflation will remain below the target (2%)? Visit our website and find out all the details.

US Inflation: 1.66% 🇺🇸

There was a 0.6 percentage point drop in the last 9 days.

Do you believe inflation will remain below the target (2%)?

Visit our website and find out all the details.
Matthew Miskin, CFA (@matthew_miskin) 's Twitter Profile Photo

A lot of talk of tariffs in yesterday's #CPI report, but per the BLS-Labor Statistics: "The index for shelter rose 0.2 percent in June and was the primary factor in the all items monthly increase." This OER print is the driver and it is not reflecting reality in the housing/rent markets.

Matthew Miskin, CFA (@matthew_miskin) 's Twitter Profile Photo

There is a famous FDR line from 1933, "the only thing we have to fear is fear itself." Well in markets today the opposite is true, the biggest fear is that there is barely any fear priced in. Great Kantro chart on PEs & high yield spreads, about as good as it gets.

There is a famous FDR line from 1933, "the only thing we have to fear is fear itself."  

Well in markets today the opposite is true, the biggest fear is that there is barely any fear priced in.  

Great <a href="/MichaelKantro/">Kantro</a> chart on PEs &amp; high yield spreads, about as good as it gets.
Matthew Miskin, CFA (@matthew_miskin) 's Twitter Profile Photo

The focus continues to be on tariff #inflation, but the biggest increases so far are in apparel and household furnishing which combined makes up ~6% of the #CPI index. Shelter at 35% gets no attention as national home prices fall for the 3rd consecutive month. FactSet

The focus continues to be on tariff #inflation, but the biggest increases so far are in apparel and household furnishing which combined makes up ~6% of the #CPI index. 

Shelter at 35% gets no attention as national home prices fall for the 3rd consecutive month. <a href="/FactSet/">FactSet</a>
Matthew Miskin, CFA (@matthew_miskin) 's Twitter Profile Photo

Yesterday everyone: no rate cuts this year! Today: why did you not just cut? BLS-Labor Statistics revisions make this a totally different picture: May was revised down by 125,000, from +144,000 to +19,000, and the change for June was revised down by 133,000, from +147,000 to +14,000.

Truflation (@truflation) 's Twitter Profile Photo

Fed is TOO LATE! True inflation is nearly 1 percentage point below the BLS CPI. They're hiding behind delayed data. The economy doesn't live in the past. It's time to cut, Powell!

Fed is TOO LATE!

True inflation is nearly 1 percentage point below the BLS CPI.

They're hiding behind delayed data. The economy doesn't live in the past.

It's time to cut, Powell!
Car Dealership Guy (@guydealership) 's Twitter Profile Photo

Wholesale used vehicle values are retreating: In July, the Manheim Used Vehicle Value Index (a key barometer for wholesale prices) fell by 0.5% vs. June—with nearly every segment declining MoM. By segment: - Compact cars: -1% - Mid-size car: -0.1% - SUVs: -0.8% - Trucks: +0.2%

Matthew Miskin, CFA (@matthew_miskin) 's Twitter Profile Photo

That looks disinflationary to me 🧐. If you are looking for an inflation re-acceleration angle, likely need either a commodity price surge or accelerating wage growth. Commodities are in check and wage growth appears to be slowing that likely spells disinflation.

Matthew Miskin, CFA (@matthew_miskin) 's Twitter Profile Photo

The labor market is still not showing signs that it will be the source of inflation via wage growth. If anything, this should put downward pressure on wage growth.

Matthew Miskin, CFA (@matthew_miskin) 's Twitter Profile Photo

From Oxford Economics and National Association of REALTORS®: "National housing inventory in July up 15.7% y/y. Home price growth continues to be weaker." One would think that this would be disinflationary, but has not showed up in BLS-Labor Statistics CPI data.
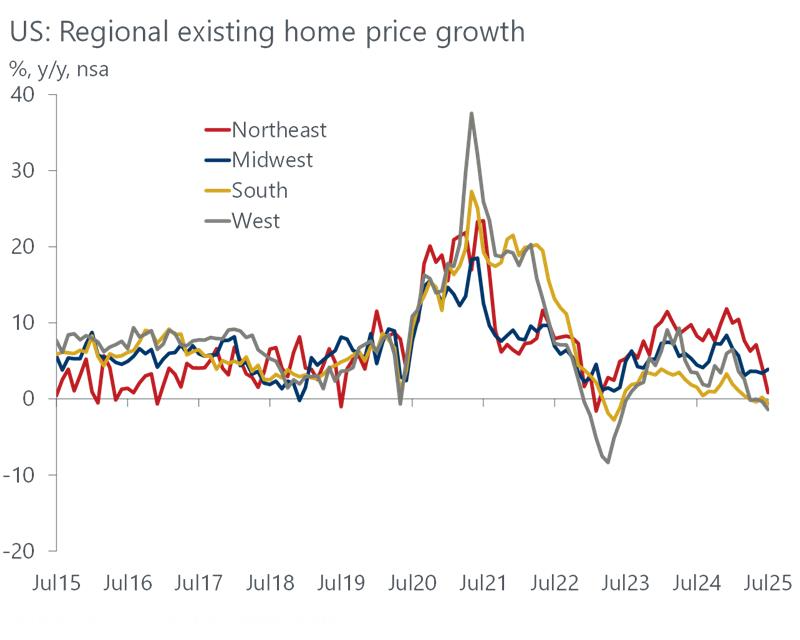
From <a href="/OxfordEconomics/">Oxford Economics</a> and <a href="/nardotrealtor/">National Association of REALTORS®</a>: "National housing inventory in July up 15.7% y/y. Home price growth continues to be weaker."

One would think that this would be disinflationary, but has not showed up in <a href="/BLS_gov/">BLS-Labor Statistics</a> CPI data.
Matthew Miskin, CFA (@matthew_miskin) 's Twitter Profile Photo

This #Fed meeting changes everything, or does it? The 2 yr. Treasury yield was where it was like a week ago. The bond market was already pricing in a cut in September. Financial conditions were already easy as Sunday morning, but likely are getting easier today.

This #Fed meeting changes everything, or does it?

The 2 yr. Treasury yield was where it was like a week ago. The bond market was already pricing in a cut in September. Financial conditions were already easy as Sunday morning, but likely are getting easier today.