Patrick De Haan ⛽️📊(@GasBuddyGuy) 's Twitter Profileg
Patrick De Haan ⛽️📊

@GasBuddyGuy

the gas price guy, “america’s best-known gas analyst”, oil & refined products analyst. myth buster/fact checker. bourbon fan. data lover. depaul alum

ID:35941034

linkhttp://patrickdehaan.com calendar_today28-04-2009 01:29:47

47,1K Tweets

65,3K Followers

2,0K Following

Follow People
Patrick De Haan ⛽️📊(@GasBuddyGuy) 's Twitter Profile Photo

just need to check my calendar to know that this is pretty spot on. naturally, become more a conversation when 1) they're high 2) they're moving 3) holidays and we're traveling

account_circle
Ryan Cummings(@weakinstrument) 's Twitter Profile Photo

1/ Neale Mahoney and I are back at it, along with our wonderfully talented colleague Giacomo Fraccaroli, examining Bad News Bias in gas prices. Using a dataset of over 1.1 million transcripts from 2004-2023, we make several new findings.

briefingbook.info/p/bad-news-bia…

account_circle
Patrick De Haan ⛽️📊(@GasBuddyGuy) 's Twitter Profile Photo

Tic tac toe, two in a row! The national average price of gasoline has fallen to $3.62/gal, a penny decline from last week, while diesel has fallen 3.4 cents to $3.94/gal.

account_circle
Patrick De Haan ⛽️📊(@GasBuddyGuy) 's Twitter Profile Photo

Truckers celebrate: the national average price of diesel is at it's lowest differential to gasoline since last August: 30c/gal (average for diesel $3.94, gasoline $3.64)

account_circle
Patrick De Haan ⛽️📊(@GasBuddyGuy) 's Twitter Profile Photo

BREAKING: According to GasBuddy data, weekly (Sun-Sat) US gasoline demand rose 0.2% last week and was 0.6% above the four week moving average. We model US gasoline demand at 8.719mbpd.

account_circle
Patrick De Haan ⛽️📊(@GasBuddyGuy) 's Twitter Profile Photo

My own visualization of the many different (switches) that drive , and basically, how much the WH and states can have an impact- small, considering the amount of switches. The most restrictive the state (California) has slightly more control, because it could ease said…
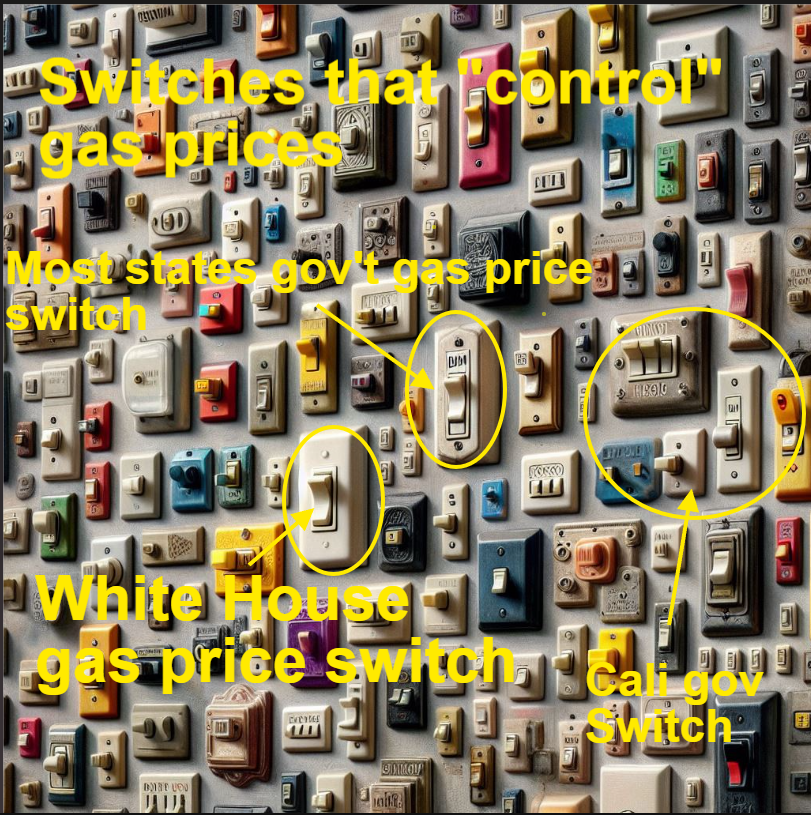
My own visualization of the many different (switches) that drive #gasprices, and basically, how much the WH and states can have an impact- small, considering the amount of switches. The most restrictive the state (California) has slightly more control, because it could ease said…
account_circle
Patrick De Haan ⛽️📊(@GasBuddyGuy) 's Twitter Profile Photo

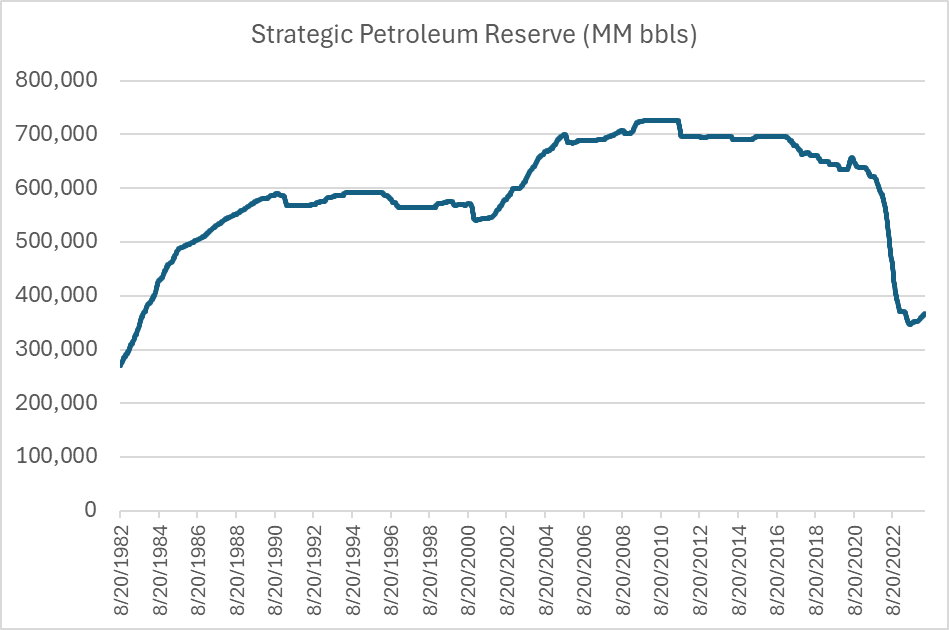
Here is the *truth* of the SPR level, using a fair axis, going back to the first week of tracked data on the reserve's level. Stop sharing part of the story, and share the truth: the SPR is over half full (366 million barrels), and is up ~20 million barrels since last July, and…

Here is the *truth* of the SPR level, using a fair axis, going back to the first week of tracked data on the reserve's level. Stop sharing part of the story, and share the truth: the SPR is over half full (366 million barrels), and is up ~20 million barrels since last July, and…
account_circle
Patrick De Haan ⛽️📊(@GasBuddyGuy) 's Twitter Profile Photo

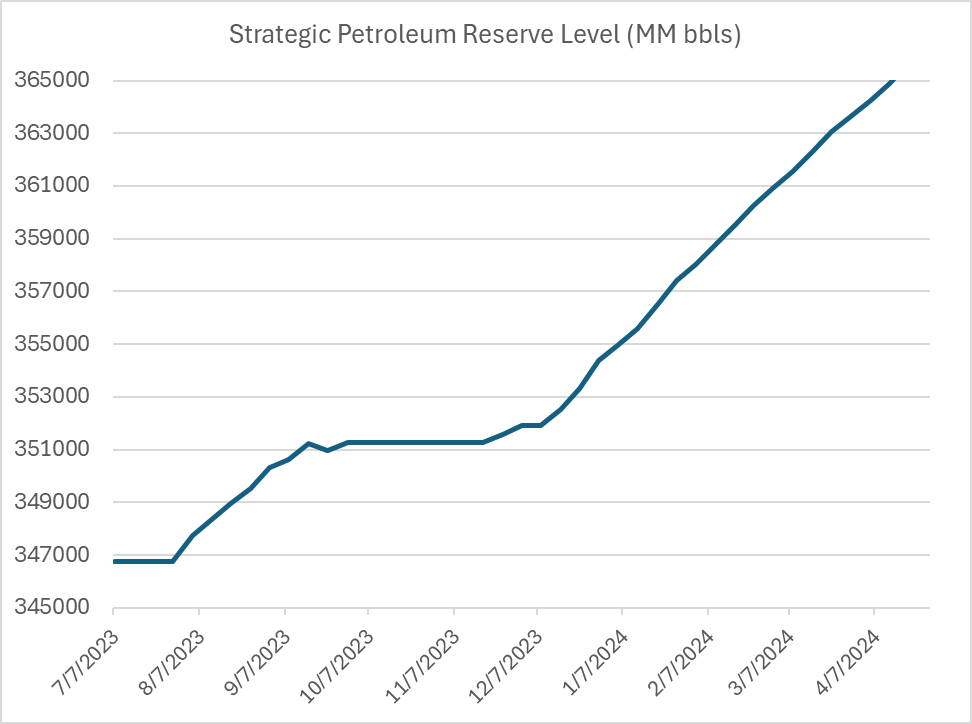
CONTEXT is *everything*. Neutral analysis means both these graphics lack context and suck. SPR declining (left) makes it look like we have no SPR left. Well, I created the equivalent of the SPR since last July in similar (poor) context on the right.

CONTEXT is *everything*. Neutral analysis means both these graphics lack context and suck. SPR declining (left) makes it look like we have no SPR left. Well, I created the equivalent of the SPR since last July in similar (poor) context on the right.
account_circle