Jeremiah Lindemann (@jer_lindemann) 's Twitter Profile
Jeremiah Lindemann

@jer_lindemann

Geographer, @Esri Solutions Engineer supporting Public Safety Solutions esri.com/en-us/industri…

ID: 60941359

linkhttp://www.esri.com calendar_today28-07-2009 16:01:51

2,2K Tweet

1,1K Takipçi

838 Takip Edilen

Eeks (@dr_eeks) 's Twitter Profile Photo

Another Causes or Cures Episode about the #opioidepidemic. Thanks to Jeremiah for sharing his story & his work, which can be helpful to states getting settlement $$ from opioid makers. Always inspired by folks who take the initiative to find solutions. buzzsprout.com/265442/11354187

Another Causes or Cures Episode about the #opioidepidemic. Thanks to Jeremiah for sharing his story & his work, which can be helpful to states getting settlement $$ from opioid makers.  
Always inspired by folks who take the initiative to find solutions.
buzzsprout.com/265442/11354187
P.J. Doherty (@pjdohertygis) 's Twitter Profile Photo

The #PhotoMappers hard at work mapping impact photos from #HurricaneIan - landfall as a Cat 4 Hurricane. Photos on 🗺 provides early situational awareness for SAR teams & emergency managers. Please share! URISA's GISCorps CEDR Digital Corps NAPSG Foundation LINK>> experience.arcgis.com/experience/d61…
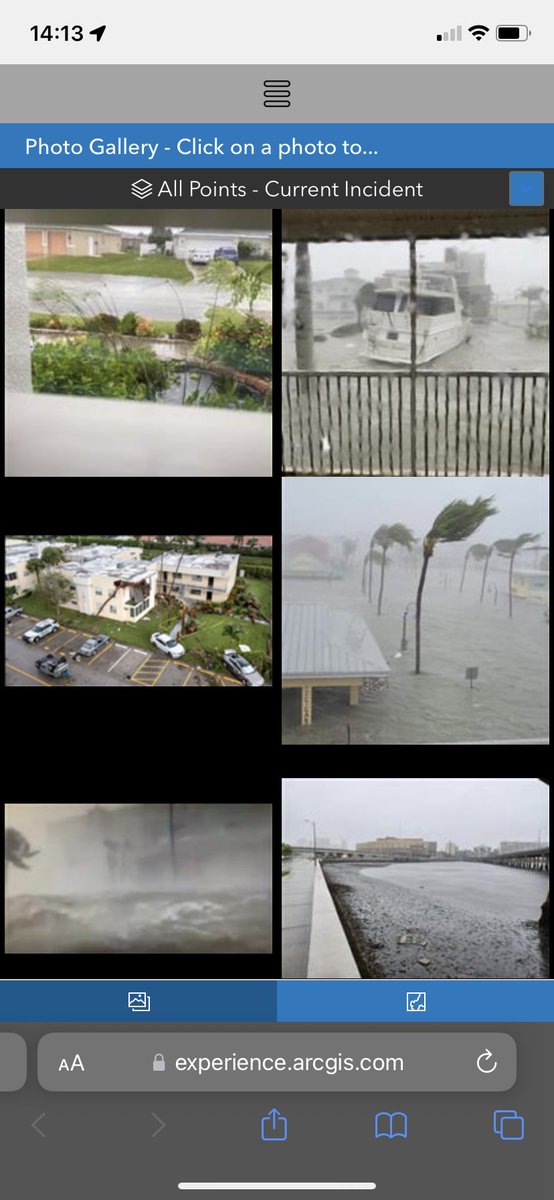
The #PhotoMappers hard at work mapping impact photos from #HurricaneIan - landfall as a Cat 4 Hurricane. Photos on 🗺 provides early situational awareness for SAR teams &amp; emergency managers. Please share! <a href="/GISCorps/">URISA's GISCorps</a> <a href="/CEDRdigital/">CEDR Digital Corps</a> <a href="/napsgfoundation/">NAPSG Foundation</a>    LINK&gt;&gt; experience.arcgis.com/experience/d61…
URISA's GISCorps (@giscorps) 's Twitter Profile Photo

The GISCorps PhotoMappers has been deployed again to provide support during Hurricane Ian. They are actively collecting and mapping damage photos from communities impacted by the hurricane. To see the photos, click here: experience.arcgis.com/experience/d61… #HurricanIan #GIS #disasterresponse

The GISCorps PhotoMappers has been deployed again to provide support during Hurricane Ian. They are actively collecting and mapping damage photos from communities impacted by the hurricane. To see the photos, click here: experience.arcgis.com/experience/d61…
#HurricanIan #GIS #disasterresponse
Este Geraghty (@estegeraghty) 's Twitter Profile Photo

For Mental Health Awareness Week, I've written a blog introducing a new #storymap highlighting the geography of America's #mentalhealth crisis. A #geographicapproach can help us understand mental health needs, risks, #disparities, and where to act. ow.ly/OkVz50KYRgZ

Times Union (@timesunion) 's Twitter Profile Photo

Data from Columbia County's overdose map, normally accessible only to first responders and health officials, show eight fatal overdoses in the first eight months of the year. FULL STORY: trib.al/ecM2zvk

Data from Columbia County's overdose map, normally accessible only to first responders and health officials, show eight fatal overdoses in the first eight months of the year.

FULL STORY: trib.al/ecM2zvk
Esri Blog (@esriblog) 's Twitter Profile Photo

A team of humanitarians Hippo Roller finds power in maps to visualize data and tell the story of how these rolling tanks are improving access to water in Africa, and unlocking time for essential pursuits. esri.social/NFb150L9kEQ

A team of humanitarians <a href="/hipporoller/">Hippo Roller</a> finds power in maps to visualize data and tell the story of how these rolling tanks are improving access to water in Africa, and unlocking time for essential pursuits. esri.social/NFb150L9kEQ
Caitlin Knowles Myers (@caitlin_k_myers) 's Twitter Profile Photo

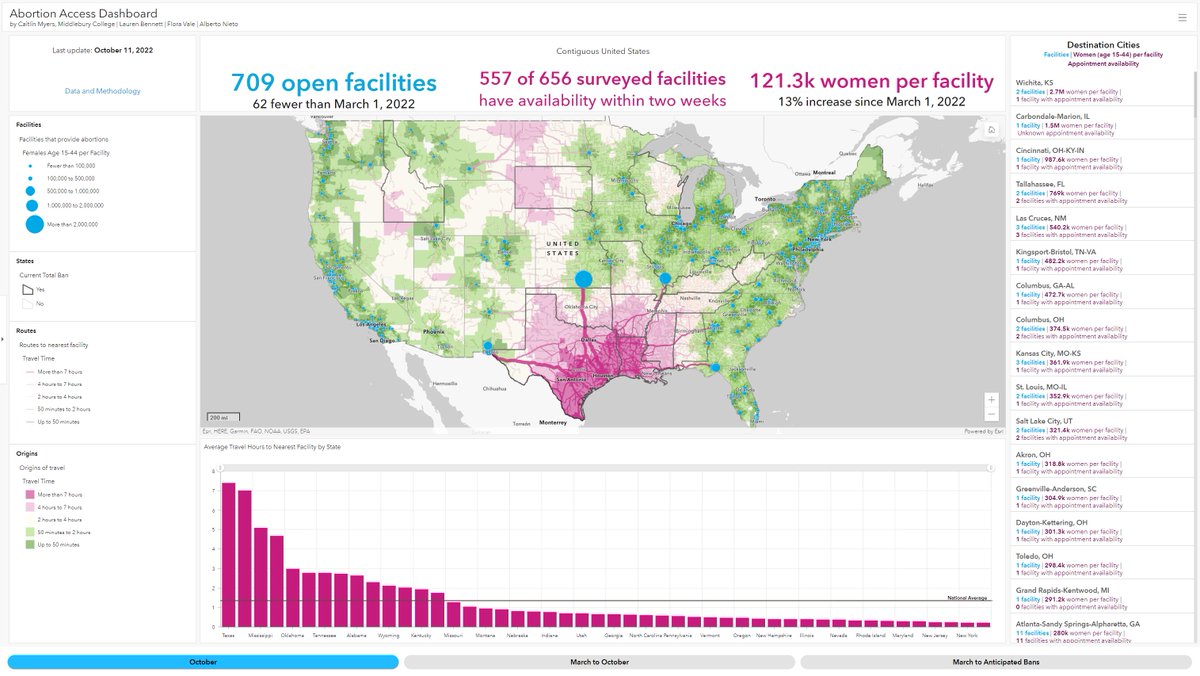
Check out how abortion access has changed since the end of #RoevWade. I just launched a new abortion access dashboard you can use to visualize changes in travel distances and appointment availability as abortion bans ripple across the country. (1/7) abortionaccessdashboard.org

Check out how abortion access has changed since the end of #RoevWade. I just launched a new abortion access dashboard you can use to visualize changes in travel distances and appointment availability as abortion bans ripple across the country. (1/7)

abortionaccessdashboard.org
Jeremiah Lindemann (@jer_lindemann) 's Twitter Profile Photo

A lot of great work has been done by 💙#MarkedByCovid #FBLC. Honored to help present here in 30 minutes to their community meetings what was done for In America Flags and how small bit on how GIS was used markedbycovid.zoom.us/meeting/regist…

UWyo News (@uwyonews) 's Twitter Profile Photo

New Immersive Story Map Brings to Life World’s Longest Mule Deer Migration | News | University of Wyoming uwyo.edu/uw/news/2022/1… #uwyo

Este Geraghty (@estegeraghty) 's Twitter Profile Photo

Have you registered yet? If not, here is some inspiration for you to justify a trip to Chicago for the 2023 Esri Health and Human Services GIS Conference on May 2-3. Please read my blog outlining 5 excellent reasons to attend... #healthGIS @Esri_health esri.com/en-us/industri…

Jeremiah Lindemann (@jer_lindemann) 's Twitter Profile Photo

Hope to see you in Chicago in May for the Esri Health and Human Services Conferences! I’ll be presenting on ArcGIS Solutions -Immunization, Opioid, Homelessness Point-in-time and more esri.com/en-us/about/ev…

Hope to see you in Chicago in May for the Esri Health and Human Services Conferences!   I’ll be presenting on ArcGIS Solutions -Immunization, Opioid, Homelessness Point-in-time and more  esri.com/en-us/about/ev…
Jeremiah Lindemann (@jer_lindemann) 's Twitter Profile Photo

When an emergency hits, it’s all hands on deck. The updated Emergency Operations Management solution allows emergency managers to quickly map evacuation areas, road closures and more. FEMA's Community Lifelines are also included. ow.ly/LG7n10527KU

When an emergency hits, it’s all hands on deck. The updated Emergency Operations Management solution allows emergency managers to quickly map evacuation areas, road closures and more. FEMA's Community Lifelines are also included. ow.ly/LG7n10527KU
Families for Safe Streets National (@fam4safestreets) 's Twitter Profile Photo

The FSS Story Map honors and remembers those lost to crashes and those who have suffered life-changing injuries. Explore stories by photo, location, or name. And, when you’re ready, we invite you to use the form to add your own story to the map. familiesforsafestreets.org/map

The FSS Story Map honors and remembers those lost to crashes and those who have suffered life-changing injuries. 

Explore stories by photo, location, or name. And, when you’re ready, we invite you to use the form to add your own story to the map.

familiesforsafestreets.org/map
Jeremiah Lindemann (@jer_lindemann) 's Twitter Profile Photo

The City of Loveland faced storm sewer challenges from floods. Using ITpipes, they integrated asset data into ArcGIS. In 5 yrs, they inspected more assets than the previous 20, leading to an $18M upgrade to protect the city & Big Thompson River. ow.ly/iTWN50SeSaE

The City of Loveland faced storm sewer challenges from floods. Using <a href="/ITpipes/">ITpipes</a>, they integrated asset data into ArcGIS. In 5 yrs, they inspected more assets than the previous 20, leading to an $18M upgrade to protect the city &amp; Big Thompson River. ow.ly/iTWN50SeSaE
Jeremiah Lindemann (@jer_lindemann) 's Twitter Profile Photo

After a natural disaster, quick and accurate damage assessments are crucial. Our Damage Assessment solution in #ArcGISOnline helps emergency management agencies evaluate the impact, ensuring timely resource allocation and recovery efforts. Learn more: ow.ly/6v7550SpzUW

Jeremiah Lindemann (@jer_lindemann) 's Twitter Profile Photo

The newly updated Homelessness Point-in-Time (PIT) Count solution and Hub site streamlines the PIT count process and allows the public to learn about volunteering opportunities. ow.ly/Qct950SRggE

The newly updated Homelessness Point-in-Time (PIT) Count solution and Hub site streamlines the PIT count process and allows the public to learn about volunteering opportunities.

ow.ly/Qct950SRggE
ArcGIS Hub (@arcgishub) 's Twitter Profile Photo

Learn how to maximize community engagement while conducting homelessness point-in-time counts in our upcoming October 24 webinar. Register here ➡️ esri.social/mbBn50TtTwZ

Learn how to maximize community engagement while conducting homelessness point-in-time counts in our upcoming October 24 webinar.

Register here ➡️ esri.social/mbBn50TtTwZ