WEWAVE.ai(@WEVVAVE) 's Twitter Profileg
WEWAVE.ai

@WEVVAVE

World's 1st AI for Chart Pattern Matching. Explore cutting-edge trading tools at https://t.co/vtAxdI7VCj. Telegram link at profile.

ID:1590096168050008065

linkhttps://t.me/+GUIZWParq0k1ODA5 calendar_today08-11-2022 21:37:47

3,5K Tweets

906 Followers

119 Following

WEWAVE.ai(@WEVVAVE) 's Twitter Profile Photo

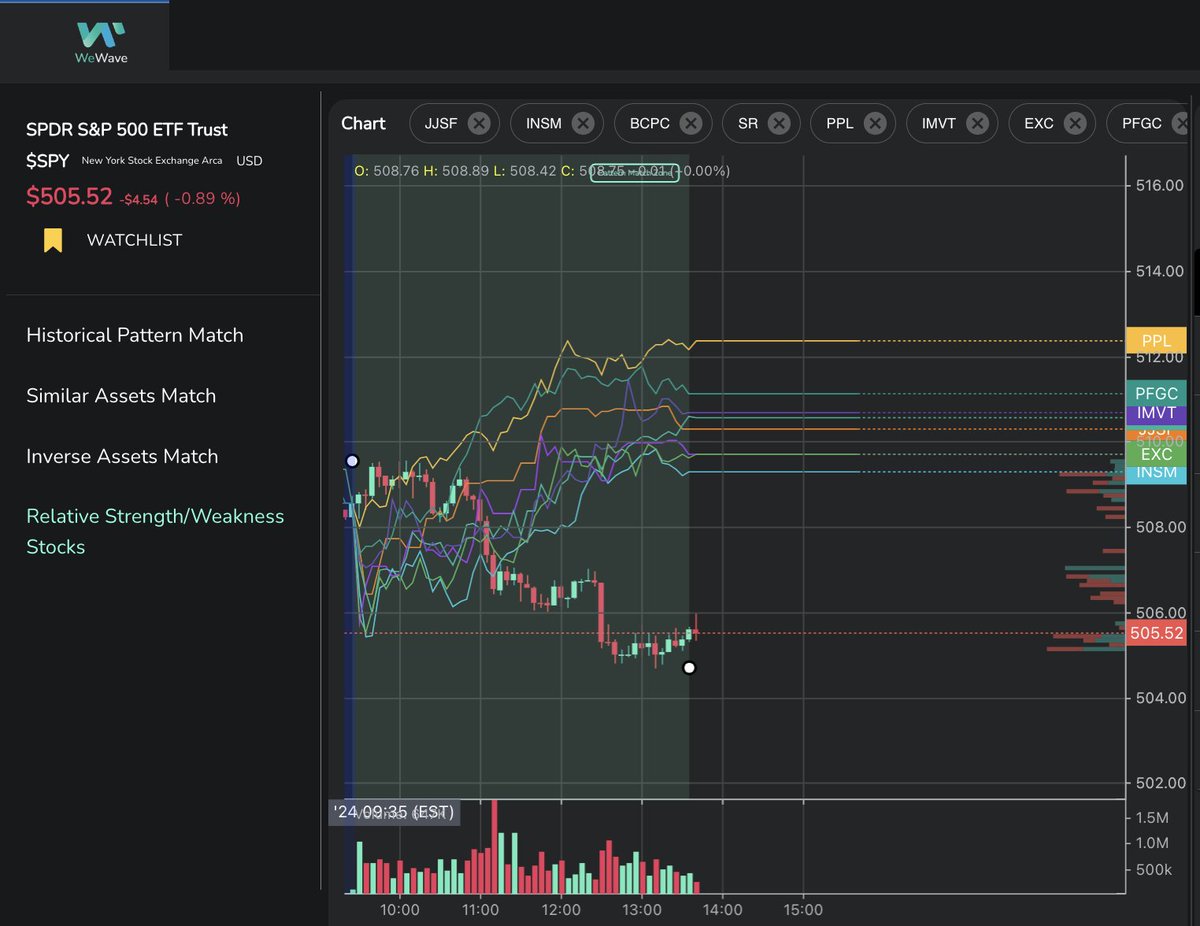
POV: Bullish Day Trader on a Bearish Day

Using a Relative Strength Scanner to find stocks showing relative strength.

$PPL $JJSF $INSM $BCPC $SR $IMVT $EXC $PFGC

POV: Bullish Day Trader on a Bearish Day Using a Relative Strength Scanner to find stocks showing relative strength. $PPL $JJSF $INSM $BCPC $SR $IMVT $EXC $PFGC #DayTrading #StockMarket #Trading #Investing #Bullish #Bearish #RelativeStrength #StocksToWatch #Finance
account_circle
WEWAVE.ai(@WEVVAVE) 's Twitter Profile Photo

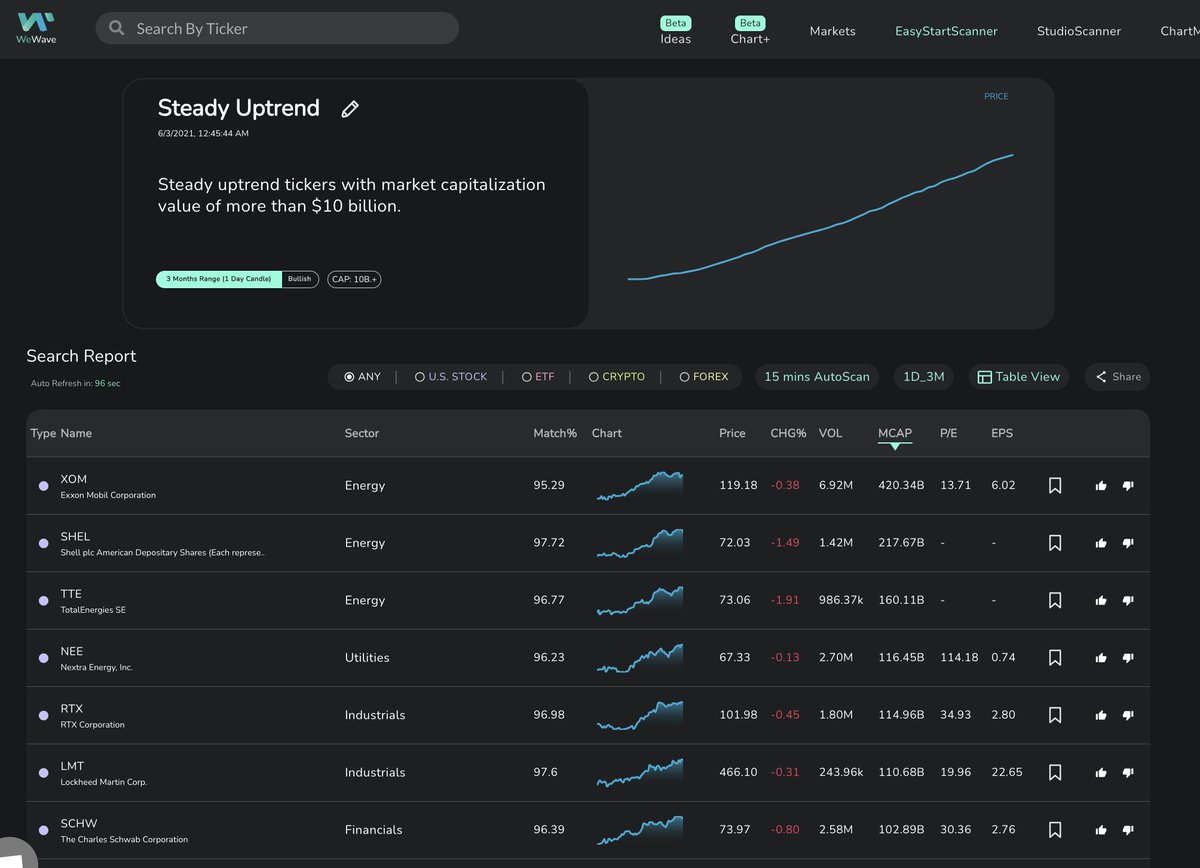
Beat Market Chop! Despite $SPY's recent volatility, these stocks have maintained a strong uptrend over the last three months:

$XOM, $SHEL, $TTE - Energy sector
$NEE - Utilities
$RTX, $LMT - Industrials
$SCHW - Financials

Discover more: wewave.app/app/easystart/…

Beat Market Chop! Despite $SPY's recent volatility, these stocks have maintained a strong uptrend over the last three months: $XOM, $SHEL, $TTE - Energy sector $NEE - Utilities $RTX, $LMT - Industrials $SCHW - Financials Discover more: wewave.app/app/easystart/… #StockMarket
account_circle
WEWAVE.ai(@WEVVAVE) 's Twitter Profile Photo

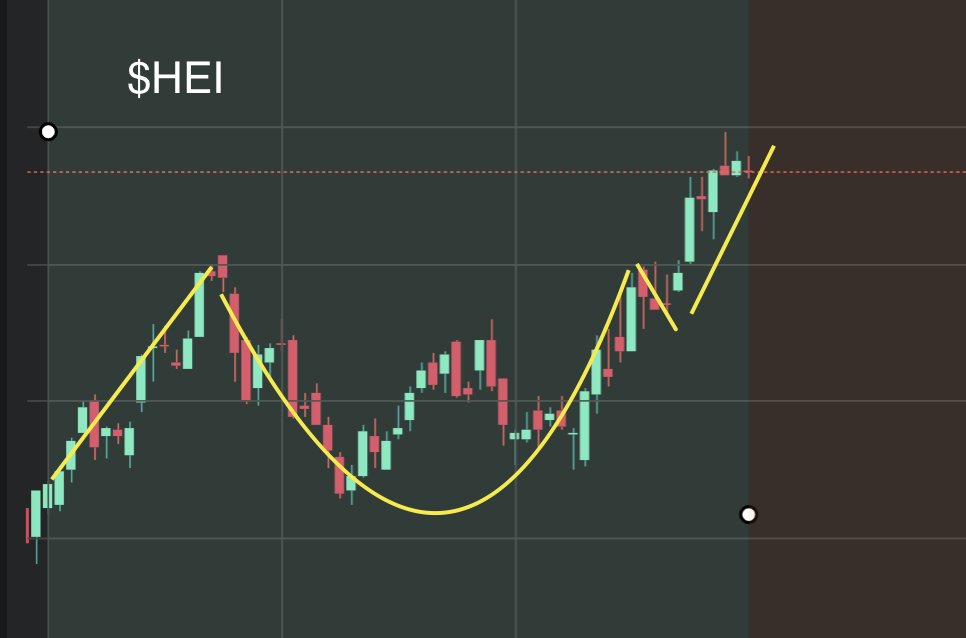
$HEI - HEICO Corp has formed a classic cup and handle p$HEI - HEICO Corp has formed a classic cup and handle pattern and continues its strong uptrend.

Find the next cup and handle play with the WeWave Cup and Handle Pattern Scanner.

$HEI - HEICO Corp has formed a classic cup and handle p$HEI - HEICO Corp has formed a classic cup and handle pattern and continues its strong uptrend. Find the next cup and handle play with the WeWave Cup and Handle Pattern Scanner. #HEI #Heico #StockMarket #Investing #Trading
account_circle
WEWAVE.ai(@WEVVAVE) 's Twitter Profile Photo

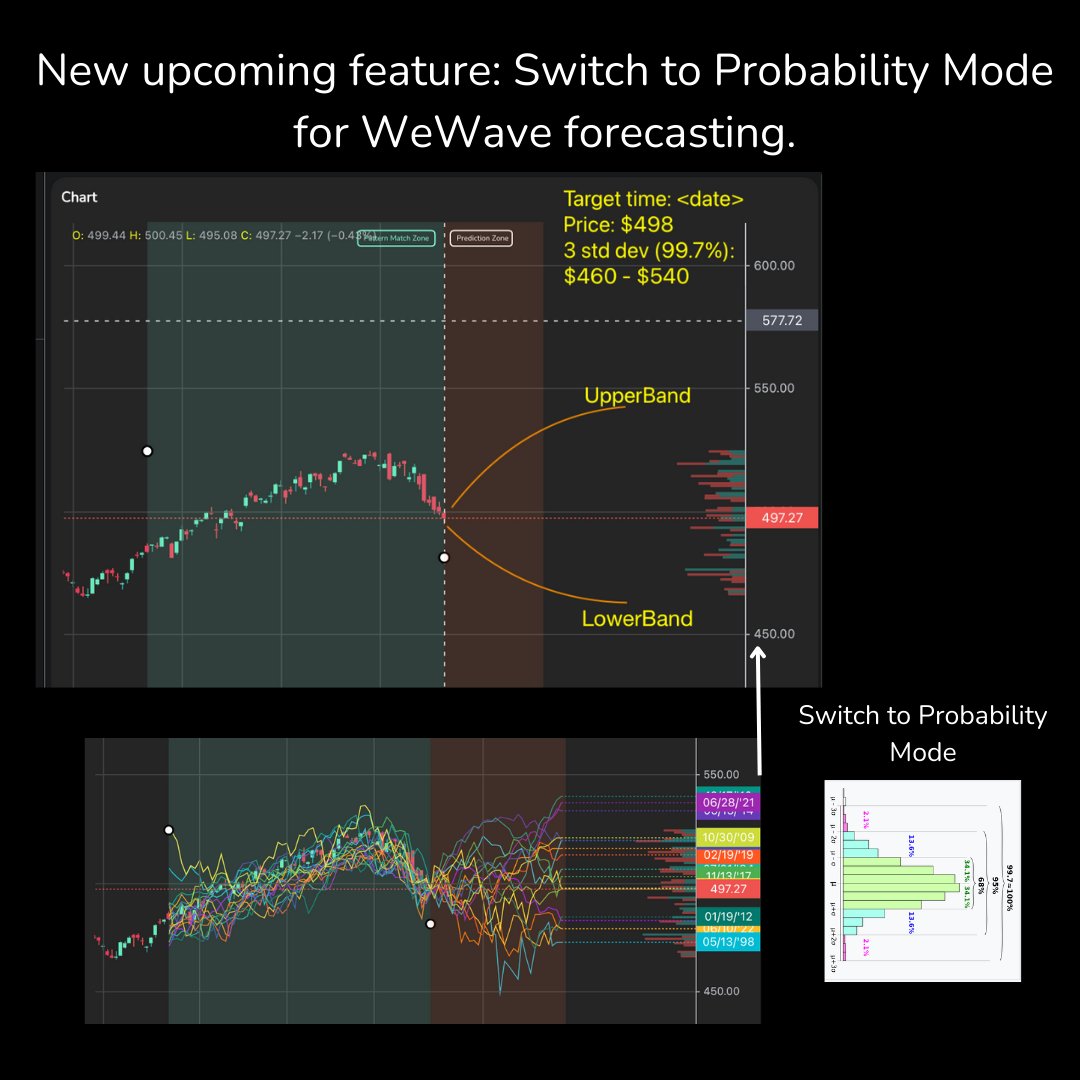
On April 29, $AAPL traded at $174.67. The one-month forward forecast projects an average increase to $178.96 (+2.5%). The forecast includes a 95% confidence interval, spanning from $163 to $193, based on 17 closely matched historical events. This range represents a two standard

account_circle
WEWAVE.ai(@WEVVAVE) 's Twitter Profile Photo

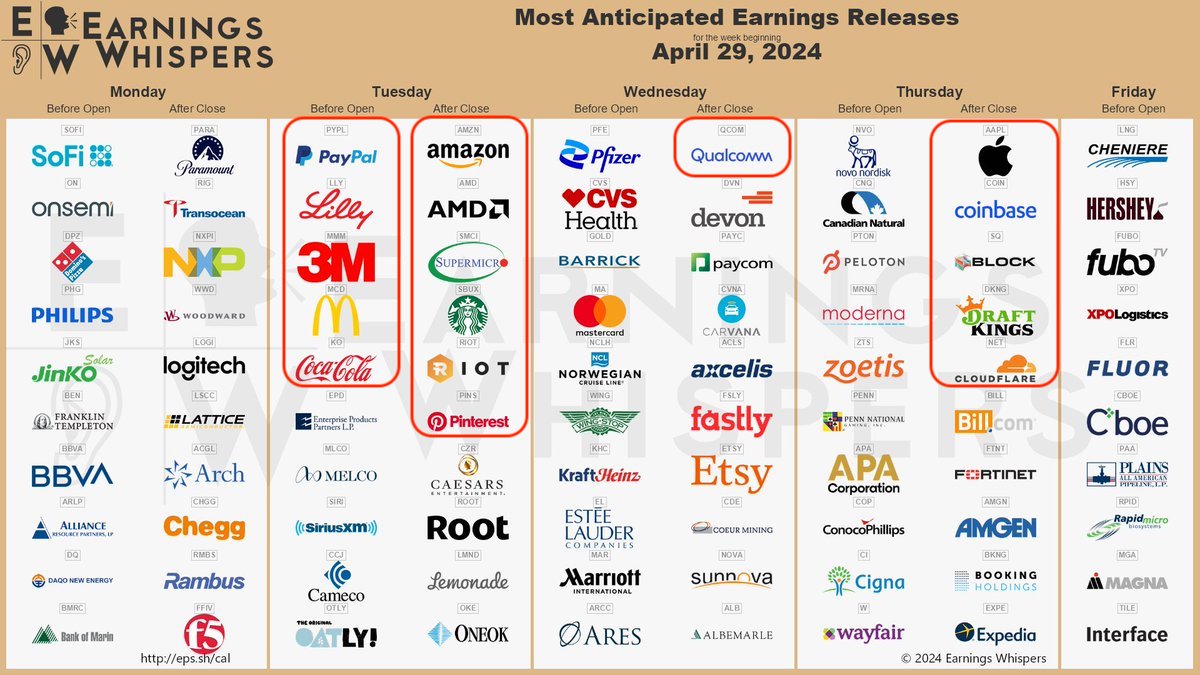
This Week's Earnings highlights: April 29, 2024


$AAPL $AMZN $AMD $SMCI $SOFI $PYPL $LLY $COIN $SQ $PFE $QCOM $SBUX $NVO $DKNG

This Week's Earnings highlights: April 29, 2024 #EARNING $AAPL $AMZN $AMD $SMCI $SOFI $PYPL $LLY $COIN $SQ $PFE $QCOM $SBUX $NVO $DKNG
account_circle
WEWAVE.ai(@WEVVAVE) 's Twitter Profile Photo

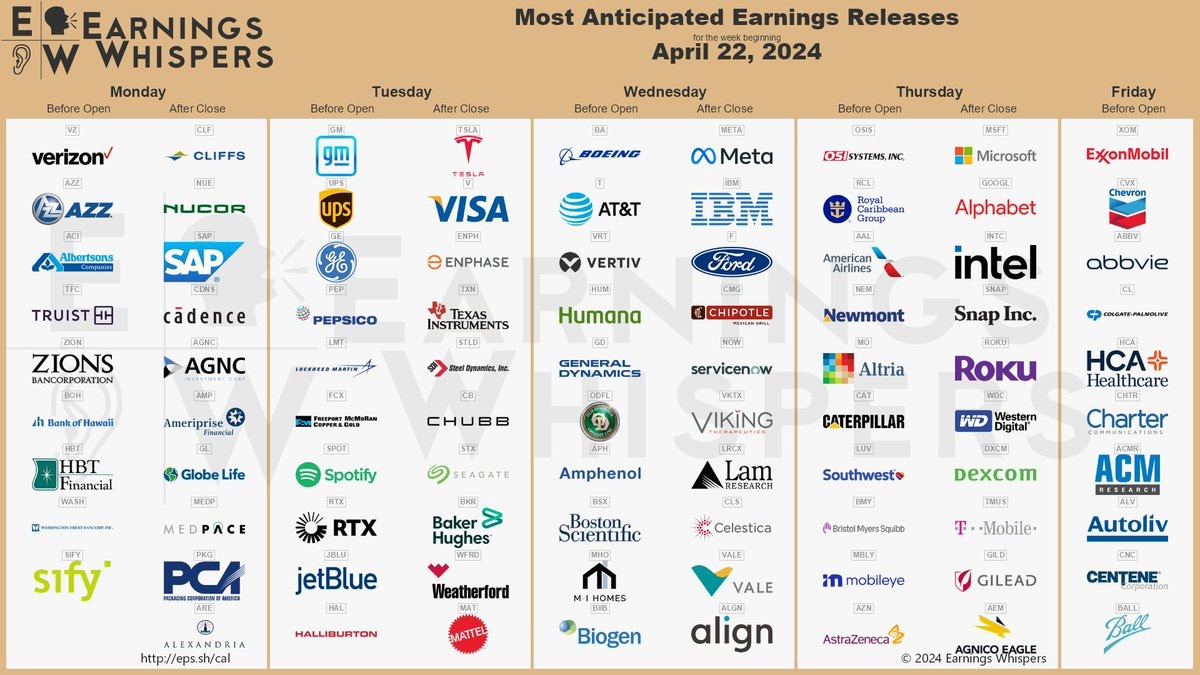
Coming week's major earnings
$MSFT $META $TSLA $GOOG $GOOGL $INTL $ROKU $XOM $V $UPS $GM $F $SNAP $ROKU $WD $TXN

Coming week's major earnings $MSFT $META $TSLA $GOOG $GOOGL $INTL $ROKU $XOM $V $UPS $GM $F $SNAP $ROKU $WD $TXN
account_circle
WEWAVE.ai(@WEVVAVE) 's Twitter Profile Photo

Great tutorial on how to calculate implied move and implied move %.

Implied move of the earning report is the option straddle price. It is the sim of AT-THE-MONEY CALL and PUT price.

And the implied move percentage will be the implied move divided by share price.

account_circle
WEWAVE.ai(@WEVVAVE) 's Twitter Profile Photo

$NVDA traders and investors: After a significant 10% drop on April 19, 2024, next week’s forecast ranges from $630 to $1037, reflecting June 2004 and January 2020 trends, respectively. Plan your investment moves wisely. For educational purposes only.

account_circle
WEWAVE.ai(@WEVVAVE) 's Twitter Profile Photo

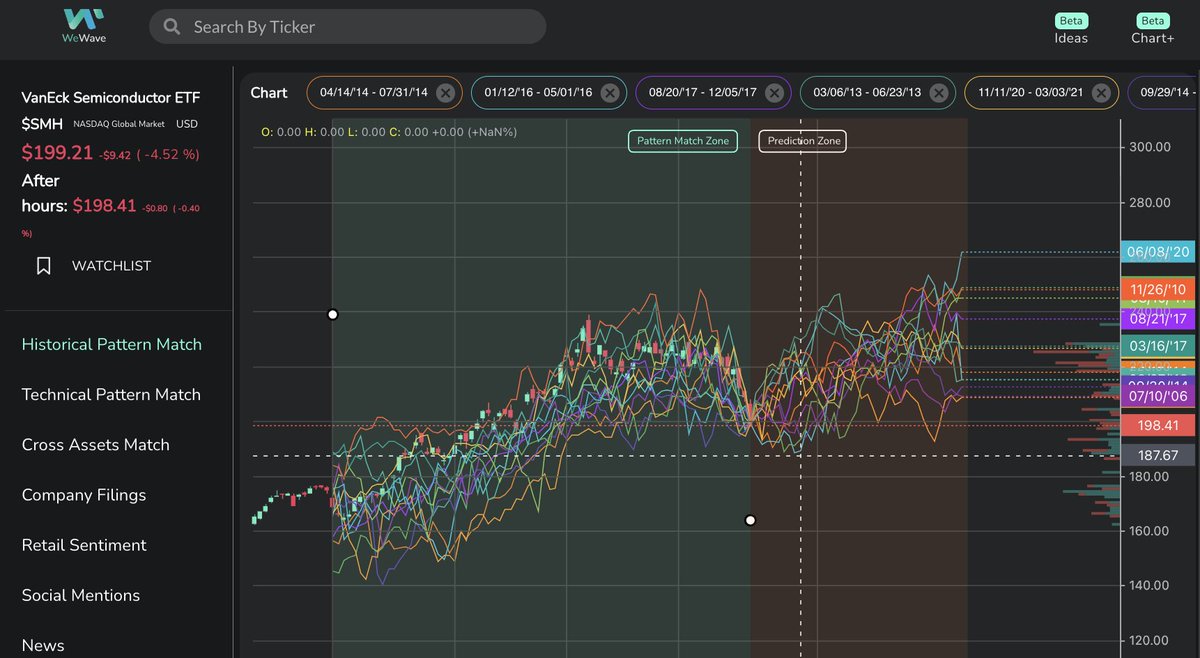
After a 5% drop on Friday, similar historical data for $SMH VanEck Semiconductor ETF suggests a strong chance of recovery. The forecasted bottom is at $187, derived from an analysis of the top 13 historical events. This analysis does not account for the volatility that next

After a 5% drop on Friday, similar historical data for $SMH VanEck Semiconductor ETF suggests a strong chance of recovery. The forecasted bottom is at $187, derived from an analysis of the top 13 historical events. This analysis does not account for the volatility that next
account_circle
WEWAVE.ai(@WEVVAVE) 's Twitter Profile Photo

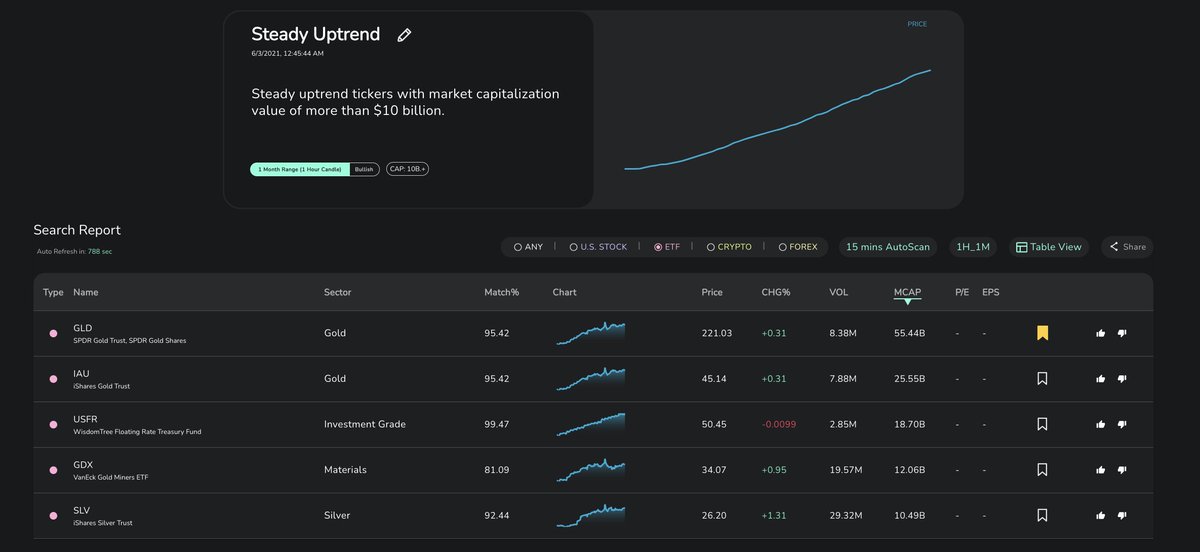
When the US market experiences a significant pullback, which stocks/ETFs continue to rise steadily? Consider $SHEL, $AZN, $NKE, $RTX, $RIO, $LMT, $GLD in the themes of energy, gold, materials, and defense.

DIY.

When the US market experiences a significant pullback, which stocks/ETFs continue to rise steadily? Consider $SHEL, $AZN, $NKE, $RTX, $RIO, $LMT, $GLD in the themes of energy, gold, materials, and defense. DIY. #trader #tradingbeginners #activetraders #stockmarket #investment
account_circle
WEWAVE.ai(@WEVVAVE) 's Twitter Profile Photo

In the coming days, we are going to release more tutorials video of how to use WEWAVE.ai to increase your trading edges. Let us know topic interests you the most ! Comment or DM us while we are preparing.

account_circle
WEWAVE.ai(@WEVVAVE) 's Twitter Profile Photo

中文用戶打個招呼吧👋👋
最近收到中文用戶的訊息希望有更多中文的教學!我們在準備中囉! 感謝大家支持

account_circle
WEWAVE.ai(@WEVVAVE) 's Twitter Profile Photo

There is always other move together in the .

Video link: youtube.com/watch?v=l_TCkc…

With WeWave's advanced technology and our cross-asset match feature, you can easily identify that demonstrate similar movements within specific timeframes, reflecting

There is always other #stocks move together in the #stockmarket . Video link: youtube.com/watch?v=l_TCkc… With WeWave's advanced technology and our cross-asset match feature, you can easily identify #stocks that demonstrate similar movements within specific timeframes, reflecting
account_circle