Shane Oliver(@ShaneOliverAMP) 's Twitter Profileg
Shane Oliver

@ShaneOliverAMP

Head of Inv Strategy & Chief Economist, AMP. Into boats, pop music, economics, investing, my family..& being nice. I don’t solicit funds/spruik trading schemes

ID:335728282

calendar_today15-07-2011 04:13:30

35,5K Tweets

32,5K Followers

126 Following

Shane Oliver(@ShaneOliverAMP) 's Twitter Profile Photo

The experience with Mid East turmoil in the last wk with gold up (1st chart) on safe haven demand but Bitcoin down (2nd chart) highlights Bitcoin is not always a reliable safe haven alternative to gold. At times it reverts to being a high beta version of shares
(Bloomberg charts)

The experience with Mid East turmoil in the last wk with gold up (1st chart) on safe haven demand but Bitcoin down (2nd chart) highlights Bitcoin is not always a reliable safe haven alternative to gold. At times it reverts to being a high beta version of shares (Bloomberg charts)
account_circle
Shane Oliver(@ShaneOliverAMP) 's Twitter Profile Photo

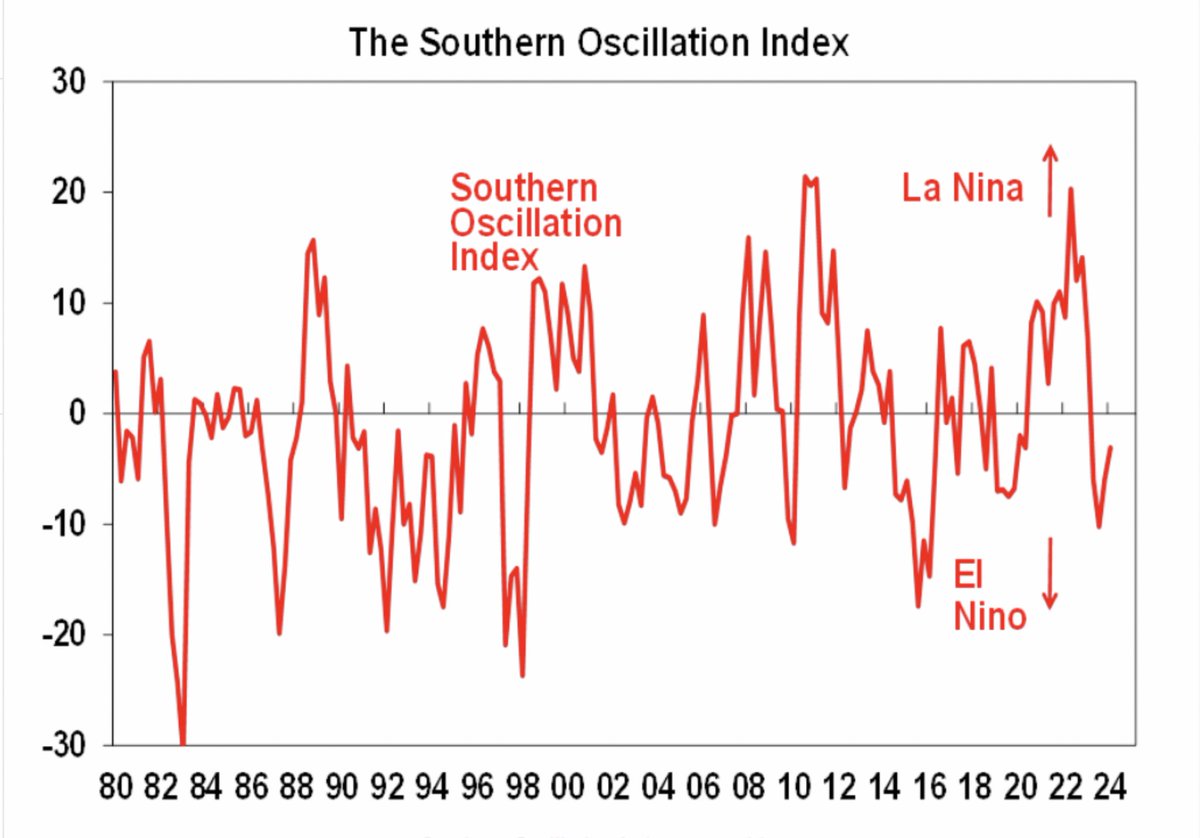
The Bureau of Meteorology’s Southern Oscillation Index may have left El Niño territory but note it can be volatile mth to mth. The second chart shows it as a quarterly average.

The latest El Niño (with less drought/more rain than feared) reminds that not El Nino’s are the same!

The Bureau of Meteorology’s Southern Oscillation Index may have left El Niño territory but note it can be volatile mth to mth. The second chart shows it as a quarterly average. The latest El Niño (with less drought/more rain than feared) reminds that not El Nino’s are the same!
account_circle
Shane Oliver(@ShaneOliverAMP) 's Twitter Profile Photo

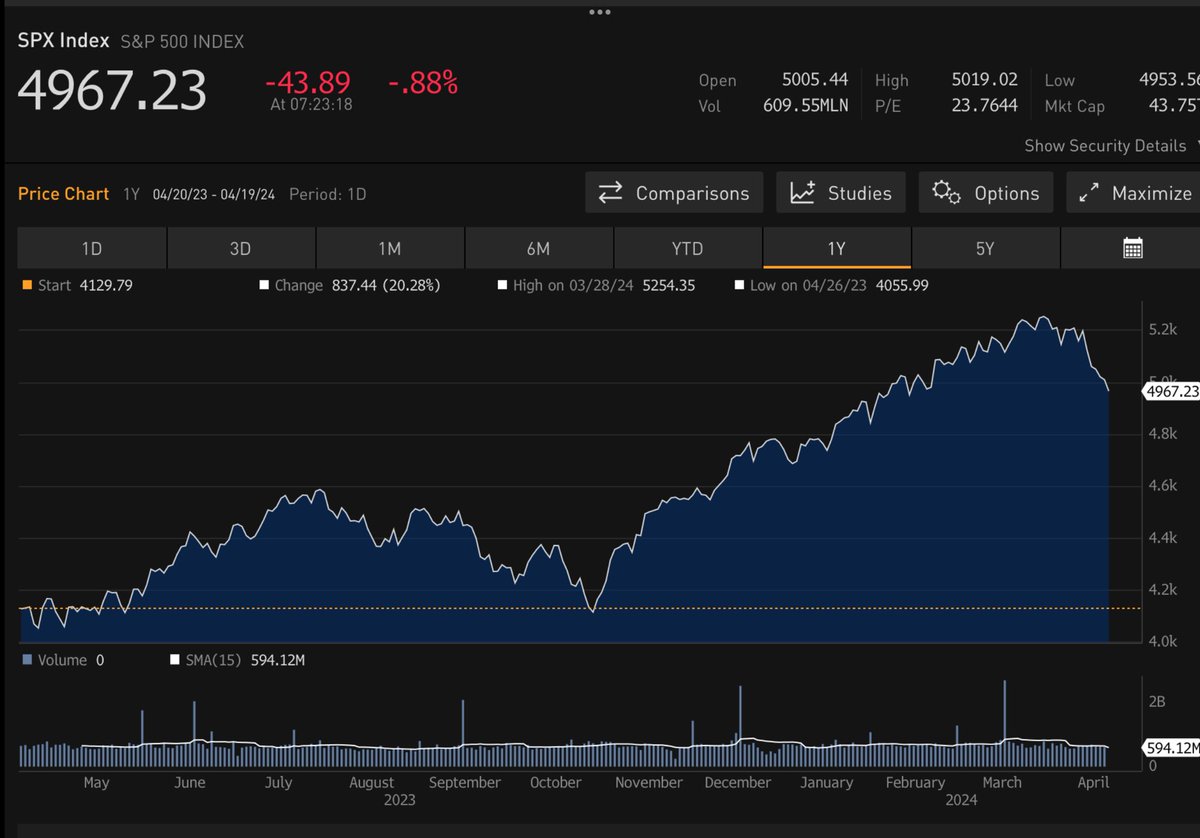
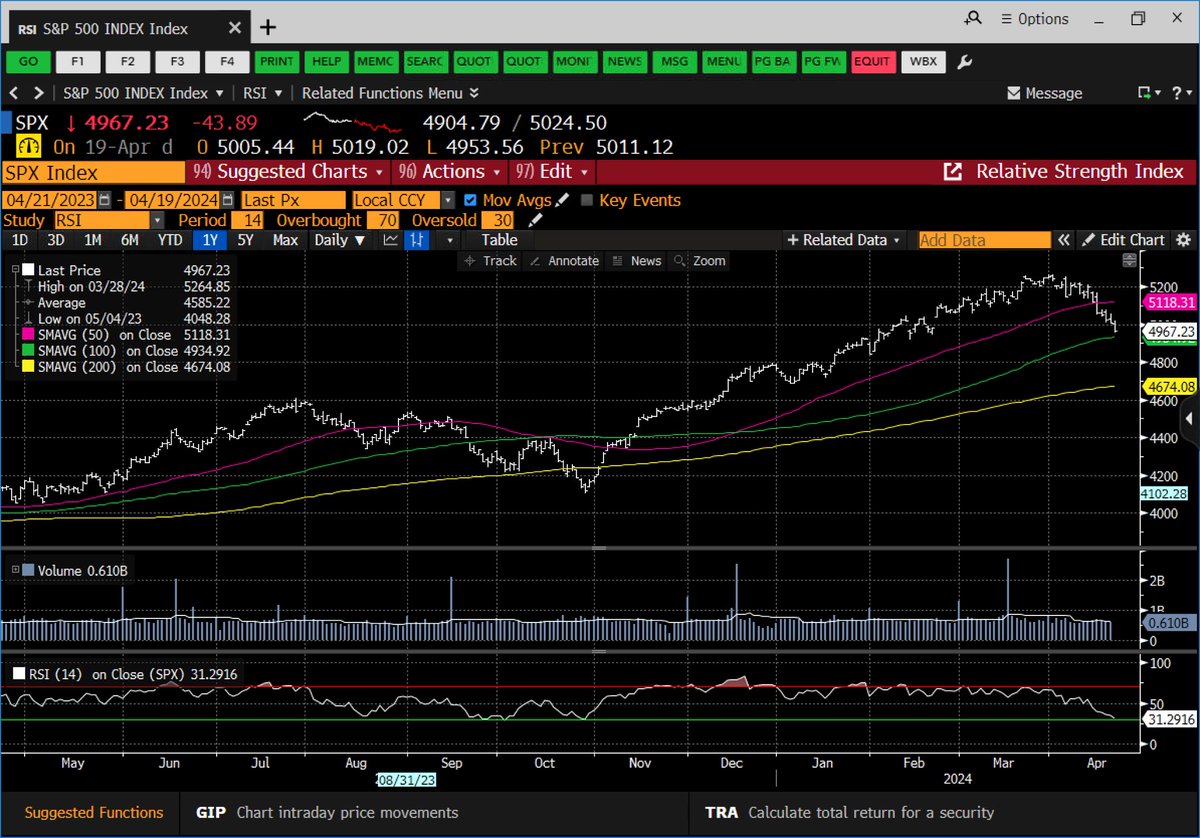
Eurozone shares -0.3% (-0.9% wk)
US shares -0.9%(-3% wk). Was +0.1% on no Israel/Iran escalation then down on worries ahead tech earnings(Nas -2.1%)
US 10 yr yld -1bp to 4.62%
Oil +0.5% to $83.1
Gold +0.5% to $2391.9
Iron ore -0.3% to $110.9
ASX futures +0.4%
$A 0.6415 w $US flat

Eurozone shares -0.3% (-0.9% wk) US shares -0.9%(-3% wk). Was +0.1% on no Israel/Iran escalation then down on worries ahead tech earnings(Nas -2.1%) US 10 yr yld -1bp to 4.62% Oil +0.5% to $83.1 Gold +0.5% to $2391.9 Iron ore -0.3% to $110.9 ASX futures +0.4% $A 0.6415 w $US flat
account_circle
Shane Oliver(@ShaneOliverAMP) 's Twitter Profile Photo

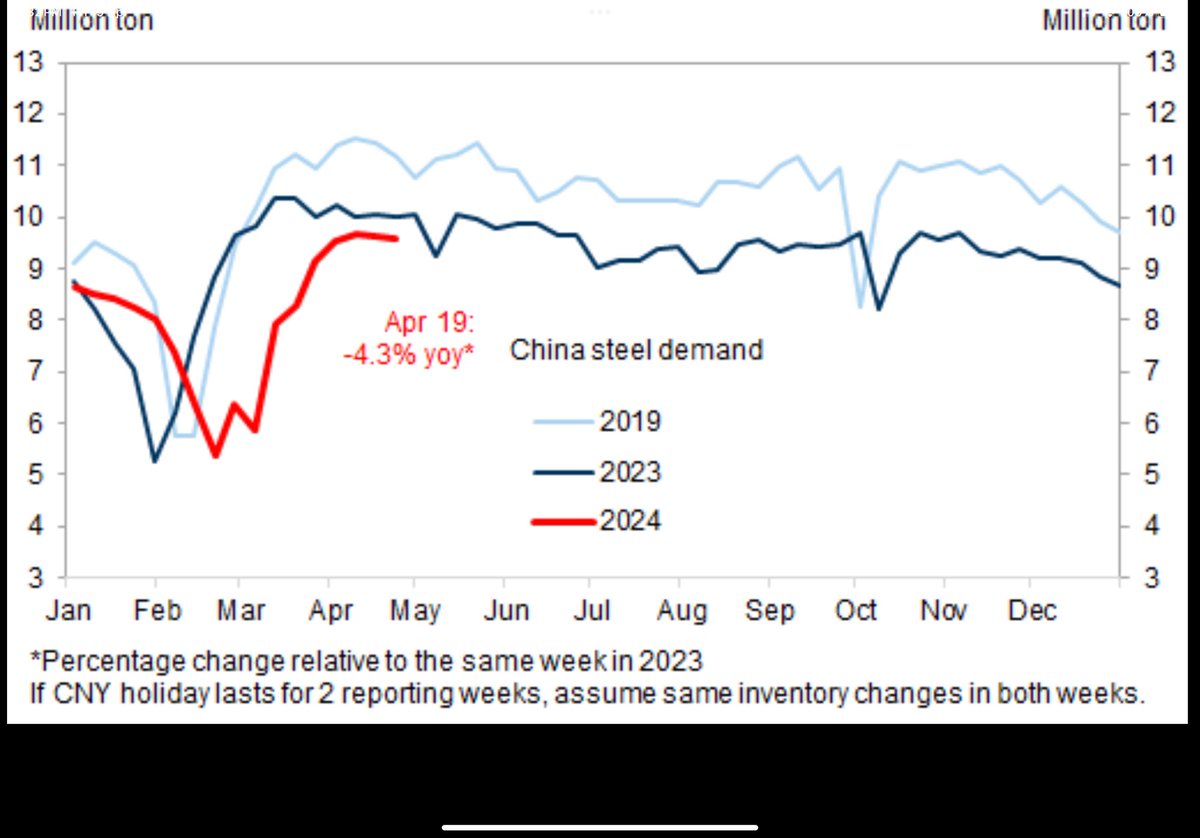
China subway usage running above 2023 and 2019,
but traffic congestion still below 2019
New property transactions running below 2023 and 2019
Same for steel demand and production
(Goldman Sachs charts-

China subway usage running above 2023 and 2019, but traffic congestion still below 2019 New property transactions running below 2023 and 2019 Same for steel demand and production (Goldman Sachs charts-
account_circle
Shane Oliver(@ShaneOliverAMP) 's Twitter Profile Photo

Weekly economic & market update - shares correcting; Iran/Israel risk; rate cut delays but inflation still falling ex US; supply boost helping cool Aust labour mkt; expect Aust Q1 CPI to slow to 3.4%yoy

amp.com.au/insights-hub/b…

account_circle
AMP(@AMP_AU) 's Twitter Profile Photo

Episode #118: How vulnerable are shares?

Join Diana Mousina and Shane Oliver this week on: Simplifying Investing Podcast Series

Full ep on:

Spotify: open.spotify.com/episode/62l5SK…

YouTube: youtube.com/watch?v=Au0lAi…

account_circle
Shane Oliver(@ShaneOliverAMP) 's Twitter Profile Photo

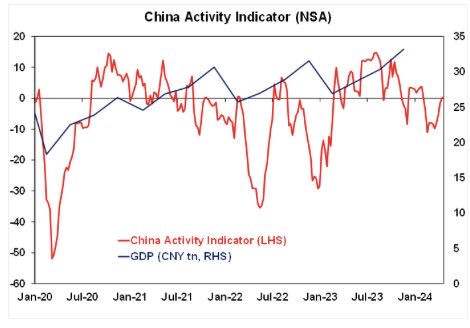
Our Economic Activity Trackers for Europe and Australia fell sharply in the last week
That for China has had a bit of a bounce though.

Our Economic Activity Trackers for Europe and Australia fell sharply in the last week That for China has had a bit of a bounce though.
account_circle
Shane Oliver(@ShaneOliverAMP) 's Twitter Profile Photo

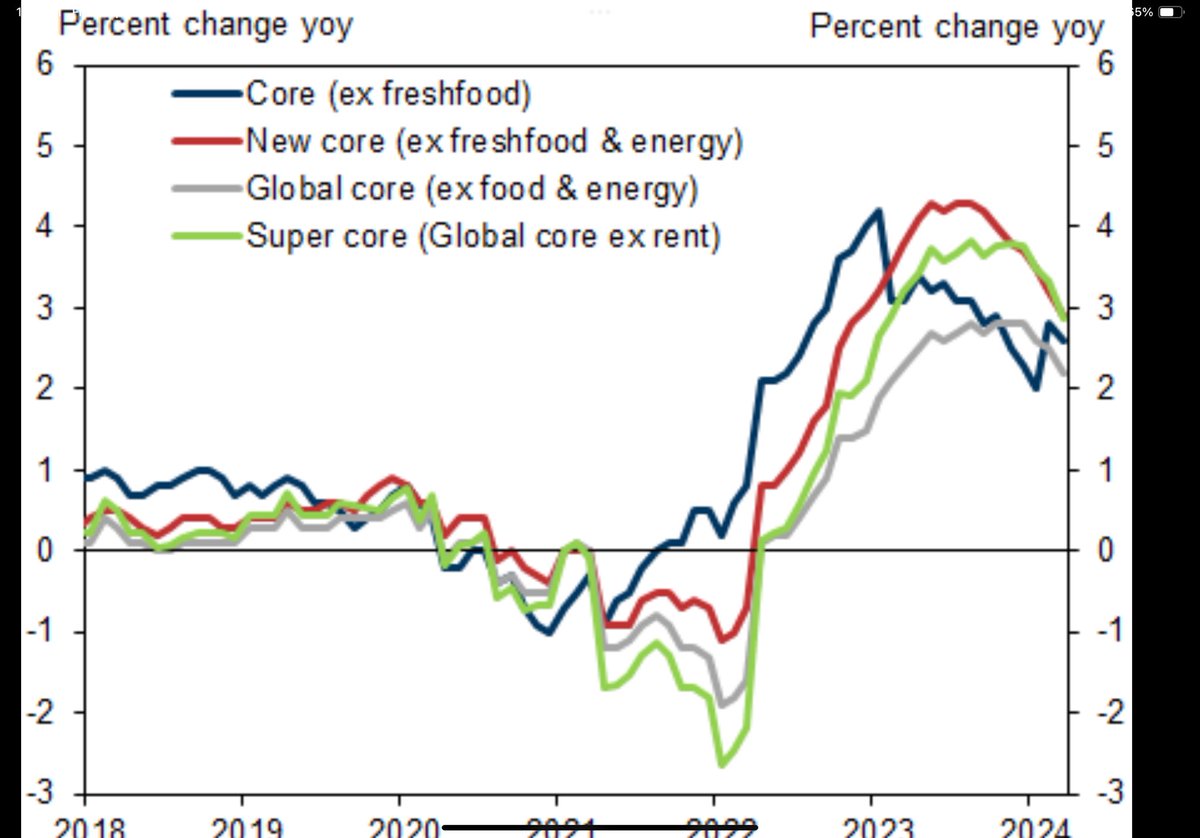
Japanese inflation fell to 2.7%yoy in March from 2.8%
US style core inflation (ie ex food and energy) fell to 2.2% from 2.5%
(Goldman Sachs chart)

Japanese inflation fell to 2.7%yoy in March from 2.8% US style core inflation (ie ex food and energy) fell to 2.2% from 2.5% (Goldman Sachs chart)
account_circle
Shane Oliver(@ShaneOliverAMP) 's Twitter Profile Photo

US Apr Phily Fed index rose to 15.5 pts. Avg of Phily Fed and Empire points to an uptick in manu & prices received in normal range.
Mar existing home sales -4.3%mom
Mar leading index -0.3%mom…back to -ve after Feb rise
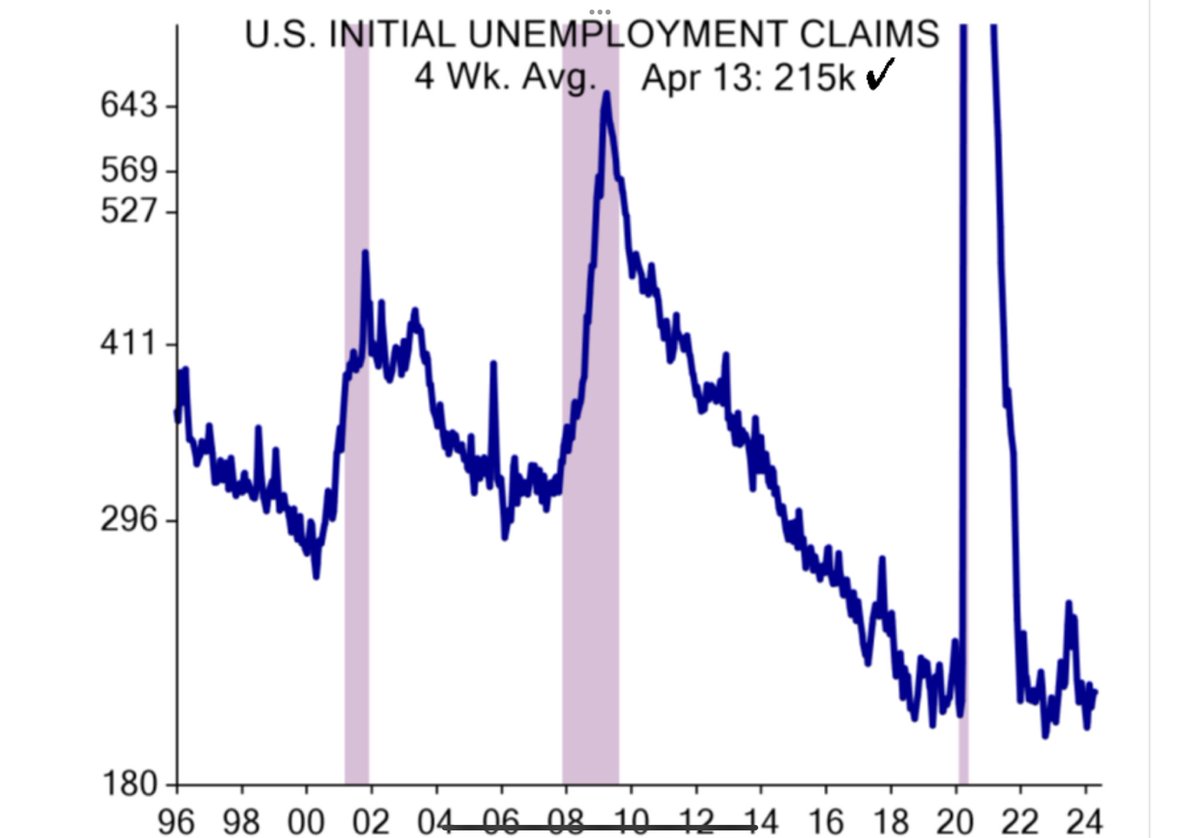
Initial jobless claims flat and low
(ISI & Bloomberg charts)

US Apr Phily Fed index rose to 15.5 pts. Avg of Phily Fed and Empire points to an uptick in manu & prices received in normal range. Mar existing home sales -4.3%mom Mar leading index -0.3%mom…back to -ve after Feb rise Initial jobless claims flat and low (ISI & Bloomberg charts)
account_circle
Shane Oliver(@ShaneOliverAMP) 's Twitter Profile Photo

Eurozone shares +0.5%
US shares -0.2%, initially +0.7% then down on hawkish Fed speak. Nasdaq -0.5%
US 10 yr yld +5bp to 4.63%
Oil +0.05% to 82.7
Gold +0.8% to $2379
Iron ore -0.1% to $110.75
ASX futures -0.7%
$A 0.642 with $US index +0.1%

account_circle
Shane Oliver(@ShaneOliverAMP) 's Twitter Profile Photo

Aust CoreLogic April mth to date home prices:
Syd +0.3% (+0.5% at mthly rate)
Mel -0.1%
Bri +0.5%
Ade +0.7%
Per +1.2% (+2% at mthly rate)
5 city avg +-0.4% (+0.6% at mthly rate)
Prices still rising but with big divergence between Perth & Adelaide versus Melbourne.

Aust CoreLogic April mth to date home prices: Syd +0.3% (+0.5% at mthly rate) Mel -0.1% Bri +0.5% Ade +0.7% Per +1.2% (+2% at mthly rate) 5 city avg +-0.4% (+0.6% at mthly rate) Prices still rising but with big divergence between Perth & Adelaide versus Melbourne.
account_circle
Antipodean Macro(@AntipodeanMacro) 's Twitter Profile Photo

Something we have highlighted for a while now is the resilience of labour market conditions in Australia for those aged 25 and over. The jobless rate for 25+ year olds was just 2.7% in March - close to the low.

Something we have highlighted for a while now is the resilience of labour market conditions in Australia for those aged 25 and over. The jobless rate for 25+ year olds was just 2.7% in March - close to the low.
account_circle
Shane Oliver(@ShaneOliverAMP) 's Twitter Profile Photo

Unemployment and underutilisation are up from their lows indicating that the jobs market is cooling, but remain very low indicating it’s still tight.

Our Jobs Leading Indicator continues to point to softer jobs growth ahead but employment has so far remained surprisingly strong

Unemployment and underutilisation are up from their lows indicating that the jobs market is cooling, but remain very low indicating it’s still tight. Our Jobs Leading Indicator continues to point to softer jobs growth ahead but employment has so far remained surprisingly strong
account_circle
Shane Oliver(@ShaneOliverAMP) 's Twitter Profile Photo

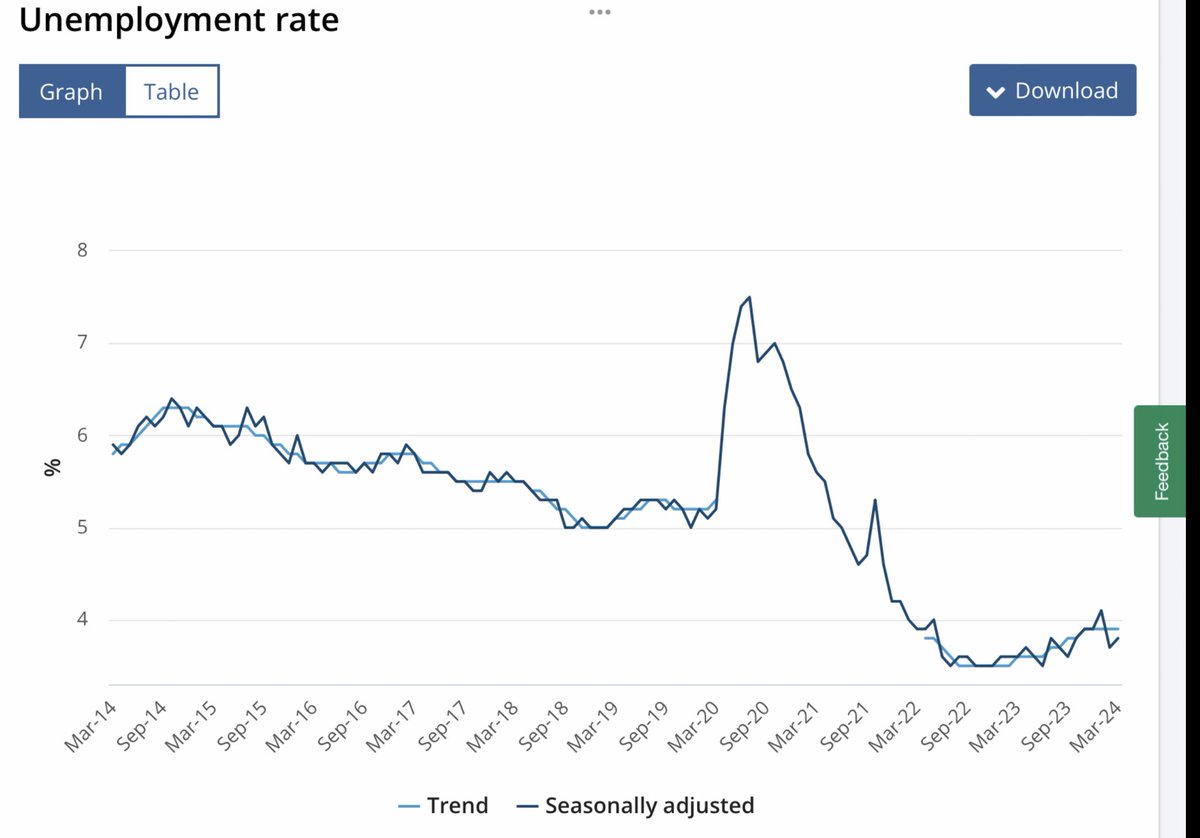
Aust Mar emp -6.6k, <exp, but after Feb +117.6k
The mix of jobs was solid with full time +28k,hrs wkd up & unemp up <exp to 3.8%. Participation slowing could be an early sign of weakness but the jobs mkt remains tight & will leave the RBA cautious on inflation & in no rush to cut

Aust Mar emp -6.6k, <exp, but after Feb +117.6k The mix of jobs was solid with full time +28k,hrs wkd up & unemp up <exp to 3.8%. Participation slowing could be an early sign of weakness but the jobs mkt remains tight & will leave the RBA cautious on inflation & in no rush to cut
account_circle
Shane Oliver(@ShaneOliverAMP) 's Twitter Profile Photo

UK March inflation fell further to 3.2%yoy from 3.4%yoy, with core and services inflation also down. However, the falls were less than expected and services inflation remains too high leaving rate cuts unlikely til Aug/Sep
(Bloomberg chart)

UK March inflation fell further to 3.2%yoy from 3.4%yoy, with core and services inflation also down. However, the falls were less than expected and services inflation remains too high leaving rate cuts unlikely til Aug/Sep (Bloomberg chart)
account_circle
Shane Oliver(@ShaneOliverAMP) 's Twitter Profile Photo

Eurozone shares -0.1%
US shares -0.6% after starting up 0.5%, Nasdaq -1.15%
US 10 yr yld -8bp to 4.59%
Oil -3.1% to $82.7
Gold -0.9% to $2361
Iron ore +2.4% to $110.85
ASX futures +0.3%
$A 0.6434 with $US index -0.4%

account_circle
Shane Oliver(@ShaneOliverAMP) 's Twitter Profile Photo

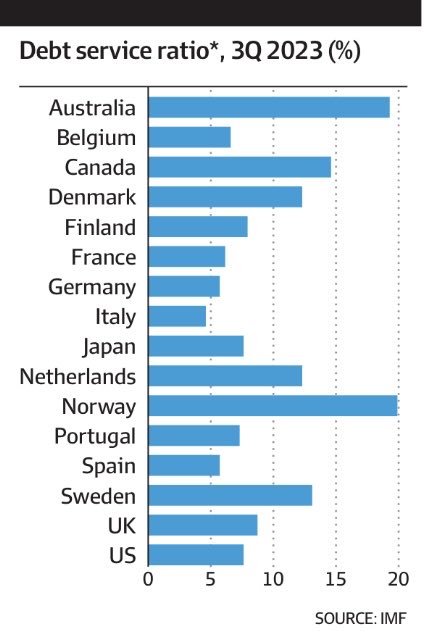
This chart showing hhold debt servicing ratios (from IMF, reproduced in AFR) highlights why Aust econ is very different to US re interest rates. It reflects a combo of much higher debt to income (from more expensive houses) & a much higher rise in actual mort rates in Aust v US

This chart showing hhold debt servicing ratios (from IMF, reproduced in AFR) highlights why Aust econ is very different to US re interest rates. It reflects a combo of much higher debt to income (from more expensive houses) & a much higher rise in actual mort rates in Aust v US
account_circle
Shane Oliver(@ShaneOliverAMP) 's Twitter Profile Photo

NZ Q1 inflation fell in line with exp: CPI +0.6%q/+4%y from 4.7%

Tradable & goods inflation down but non-tradeables & services remain a problem (but mostly due to volatile & govt related items)

Core measures still trending down & just below top of target
(Goldman Sachs charts)

NZ Q1 inflation fell in line with exp: CPI +0.6%q/+4%y from 4.7% Tradable & goods inflation down but non-tradeables & services remain a problem (but mostly due to volatile & govt related items) Core measures still trending down & just below top of target (Goldman Sachs charts)
account_circle
Shane Oliver(@ShaneOliverAMP) 's Twitter Profile Photo

IMF again revised up is global growth forecast for 2024 to 3.2% (same as 2023 turned out to be) driven by faster grth in the US.
Its 2025 forecast was unchanged at 3.2%.
3.2% global grth was around normal in the pre-covid period, altho the IMF usually started off more optimistic.

IMF again revised up is global growth forecast for 2024 to 3.2% (same as 2023 turned out to be) driven by faster grth in the US. Its 2025 forecast was unchanged at 3.2%. 3.2% global grth was around normal in the pre-covid period, altho the IMF usually started off more optimistic.
account_circle
Shane Oliver(@ShaneOliverAMP) 's Twitter Profile Photo

Canada Mar CPI 2.9%yoy,up from 2.8%yoy as exp
But core median fell more than exp to 2.8%yoy, and core trim fell more than exp to 3.1%
Keeps BoC on track for Jun cut
Gov Macklem said “we dont have to do what the Fed does..we do what Can needs” =>relevance for RBA!
Bloomberg charts

Canada Mar CPI 2.9%yoy,up from 2.8%yoy as exp But core median fell more than exp to 2.8%yoy, and core trim fell more than exp to 3.1% Keeps BoC on track for Jun cut Gov Macklem said “we dont have to do what the Fed does..we do what Can needs” =>relevance for RBA! Bloomberg charts
account_circle