Joseph Lavorgna(@Lavorgnanomics) 's Twitter Profileg
Joseph Lavorgna

@Lavorgnanomics

Former Chief Economist of The White House National Economic Council under President Trump

ID:617381538

calendar_today24-06-2012 17:18:39

810 Tweets

33,2K Followers

62 Following

Joseph Wang(@FedGuy12) 's Twitter Profile Photo

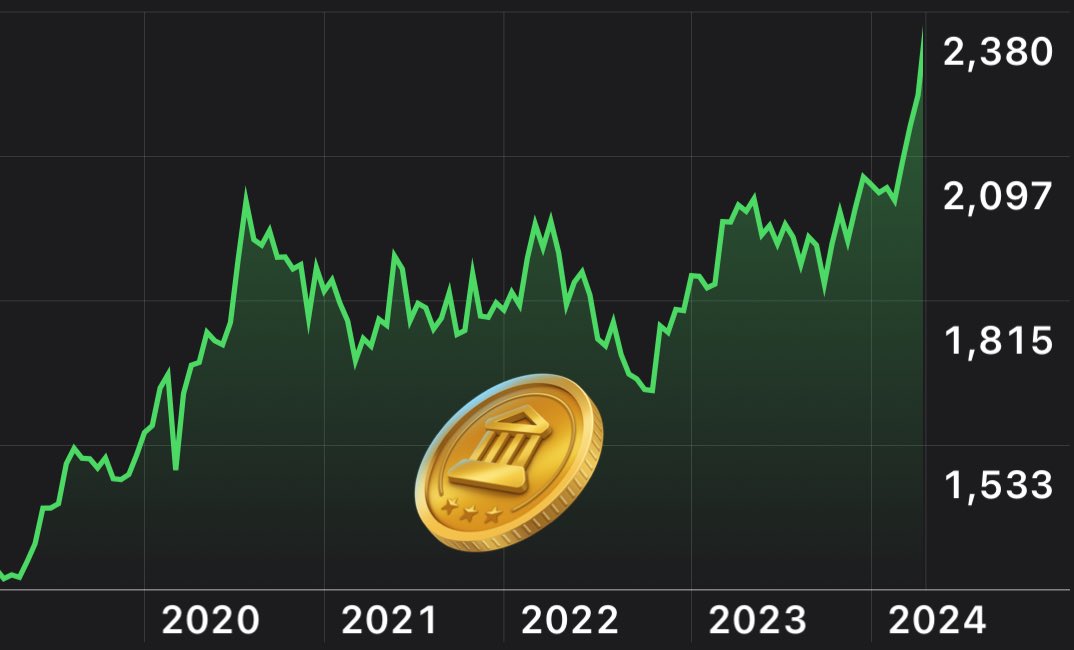
Gold still surging - kinda concerning. Maybe someone is preparing for a big geopolitical move as they know they'll lose their dollars and euros after the fact.

Gold still surging - kinda concerning. Maybe someone is preparing for a big geopolitical move as they know they'll lose their dollars and euros after the fact.
account_circle
Lisa Abramowicz(@lisaabramowicz1) 's Twitter Profile Photo

US 10-year Treasuries are having their worst day since May 2023, with yields surging after the one-two punch of a hot CPI and a bad auction. Peter Boockvar: '10 yr auction was bad...Dealers were left with 24% of the auction, which is the most since Nov. 2022.'
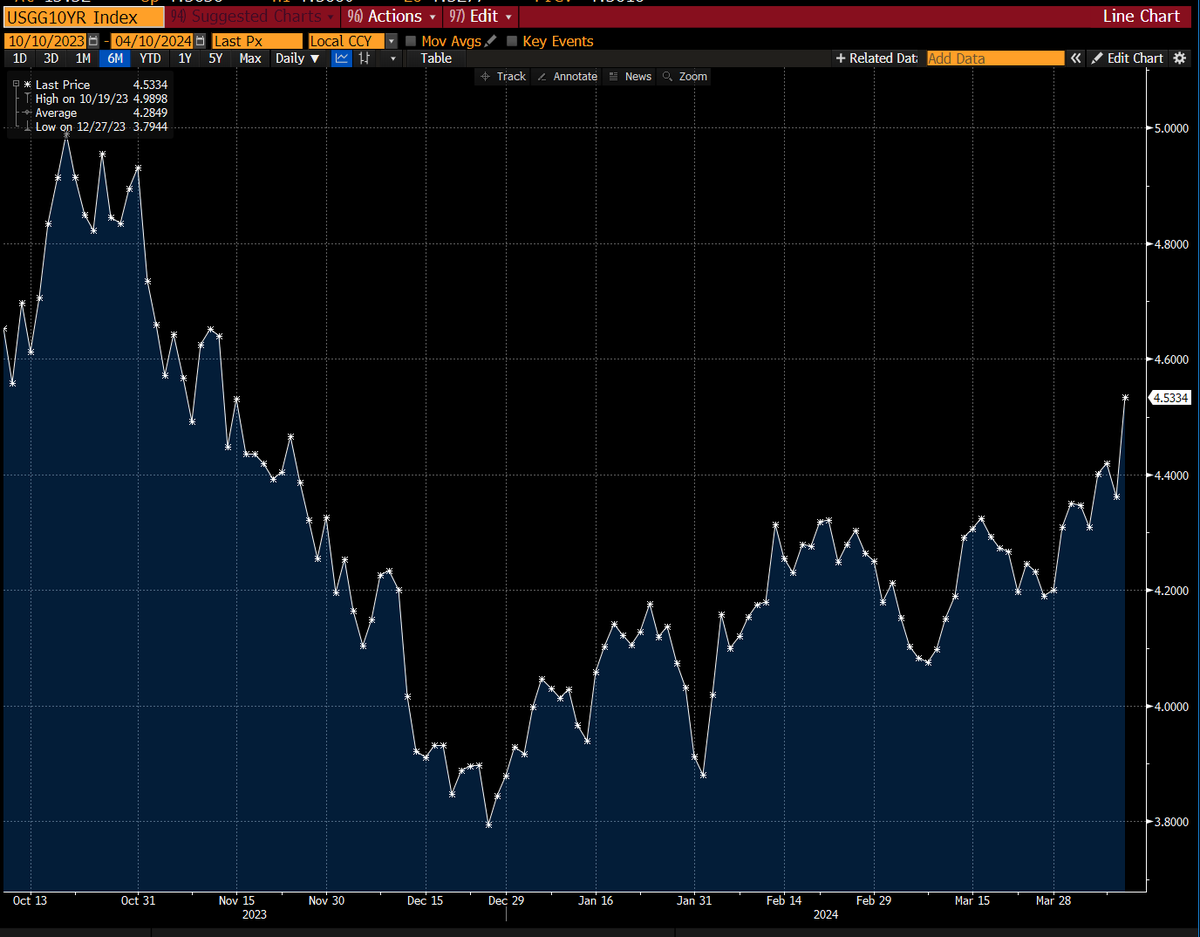
US 10-year Treasuries are having their worst day since May 2023, with yields surging after the one-two punch of a hot CPI and a bad auction. @pboockvar: '10 yr auction was bad...Dealers were left with 24% of the auction, which is the most since Nov. 2022.'
account_circle
Joseph Lavorgna(@Lavorgnanomics) 's Twitter Profile Photo

.Federal Reserve is in a serious but it can’t cut rates with high and rising rate so the only way the yield curve can normalize is if term premium surges which it could given record large budget deficits. Soaring long term interest rates would depress risk assets

account_circle
Craig Shapiro(@ces921) 's Twitter Profile Photo

As we look ahead to the all important CPI figure out tomorrow, I wanted to shed some light on this very interesting breakdown of the composition of the CPI indexes which looks at the % of components which are above 2% and above 4%.

Various Fed members in recent weeks have…

As we look ahead to the all important CPI figure out tomorrow, I wanted to shed some light on this very interesting breakdown of the composition of the CPI indexes which looks at the % of components which are above 2% and above 4%. Various Fed members in recent weeks have…
account_circle
Jim Bianco(@biancoresearch) 's Twitter Profile Photo

The biggest reason to expect rate cuts is “Jay told us he would cut.”

Otherwise, it would be very difficult to make the case given recent data, which argues that cuts are not necessary.

BTW, Jay says lots of things.
I'm old enough to remember “transitory.”
——
From the story:…

account_circle
Geiger Capital(@Geiger_Capital) 's Twitter Profile Photo

5 year returns…

Gold: +83%
S&P 500: +80%

500 of America’s best and largest companies that drive profits and innovation vs. a yellow rock that produces nothing.

This is what happens when US growth is fueled by deficit spending and dollars are being printed by the Trillion.

5 year returns… Gold: +83% S&P 500: +80% 500 of America’s best and largest companies that drive profits and innovation vs. a yellow rock that produces nothing. This is what happens when US growth is fueled by deficit spending and dollars are being printed by the Trillion.
account_circle
Alf(@MacroAlf) 's Twitter Profile Photo

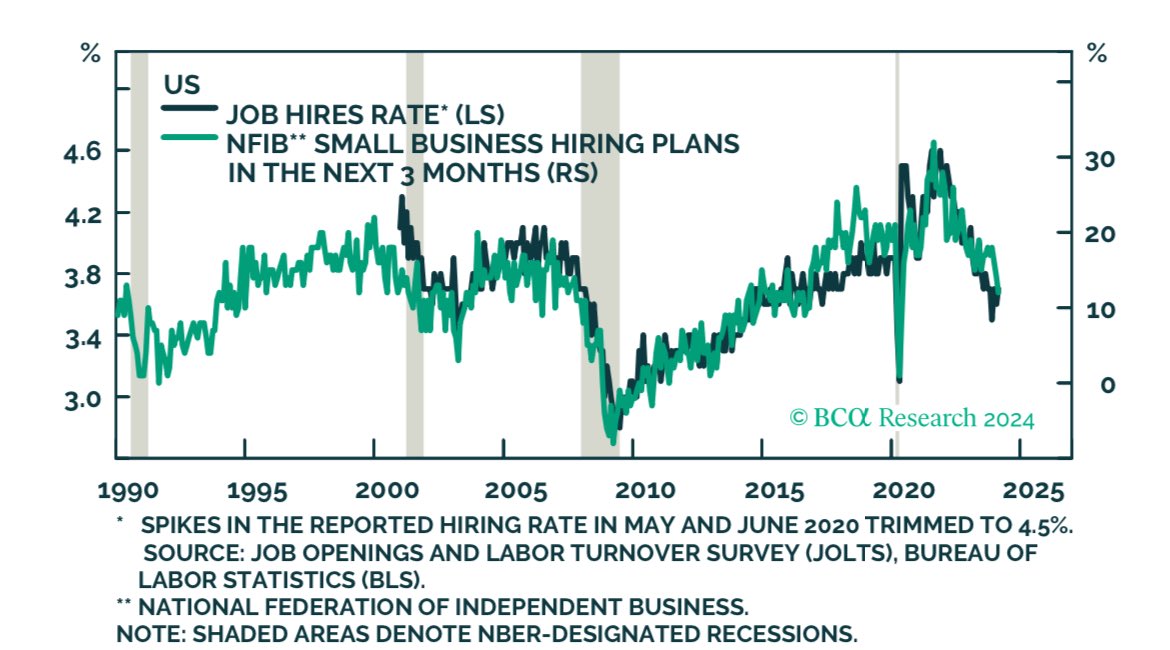
The job market is strong, right…

That’s why we have the least amount of voluntary quits since 2017.

In a strong labor market people quit to get paid better elsewhere, they don’t stick to their job as they have no valid alternative!

account_circle
The Kobeissi Letter(@KobeissiLetter) 's Twitter Profile Photo

Current situation:

1. Stocks are rising like the Fed is about to cut rates

2. Bonds are falling like rate hikes are coming back

3. Gold prices are rising like we are entering a recession

4. Oil prices are rising like the economy is perfectly fine

5. is at all time…

account_circle
Michael Green(@profplum99) 's Twitter Profile Photo

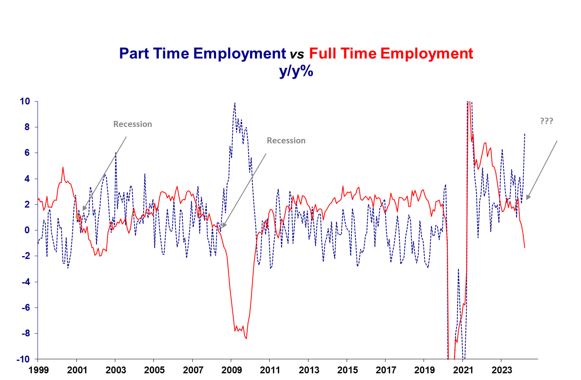
It just doesn't stop. A 'blow out' employment number with falling full-time employment? Last 10 months, full-time down 2MM, part-time up 1.8MM.

Hard to argue this wasn't a 'better' report, but data quality remains garbage.

It just doesn't stop. A 'blow out' employment number with falling full-time employment? Last 10 months, full-time down 2MM, part-time up 1.8MM. Hard to argue this wasn't a 'better' report, but data quality remains garbage.
account_circle
David Rosenberg(@EconguyRosie) 's Twitter Profile Photo

March Madness: A booming labor market that sees +303k on headline nonfarm payrolls while full-time employment from the rival Household survey drops -6k and is down -1.8 million since last November — which has only in the past happened in recessions. A real head scratcher.

account_circle
Warren Pies(@WarrenPies) 's Twitter Profile Photo

MARCH JOBS

+300k sounds hot, BUT more than 50% government + education/health.

This continues the trend of government jobs growing much faster than private sector.

MARCH JOBS +300k sounds hot, BUT more than 50% government + education/health. This continues the trend of government jobs growing much faster than private sector.
account_circle
steph pomboy(@spomboy) 's Twitter Profile Photo

Nothing about this chart suggests we have a 'strong' labor market. Far from it. FT jobs down -1.3% yy...PT jobs up 7.5%y/y

Nothing about this chart suggests we have a 'strong' labor market. Far from it. FT jobs down -1.3% yy...PT jobs up 7.5%y/y
account_circle
Jim Bianco(@biancoresearch) 's Twitter Profile Photo

Two Fed Headlines today 11 minutes apart.

Can anyone explain?
---
* FED'S GOOLSBEE: IF HOUSING INFLATION DOES NOT COME DOWN, WOULD BE VERY DIFFICULT TO RETURN INFLATION TO 2%.

* FED'S BARKIN: IT IS CONCEIVABLE THAT 2% TARGET IS MET WITHOUT SHELTER INFLATION RETURNING TO WHAT…

account_circle
David Rosenberg(@EconguyRosie) 's Twitter Profile Photo

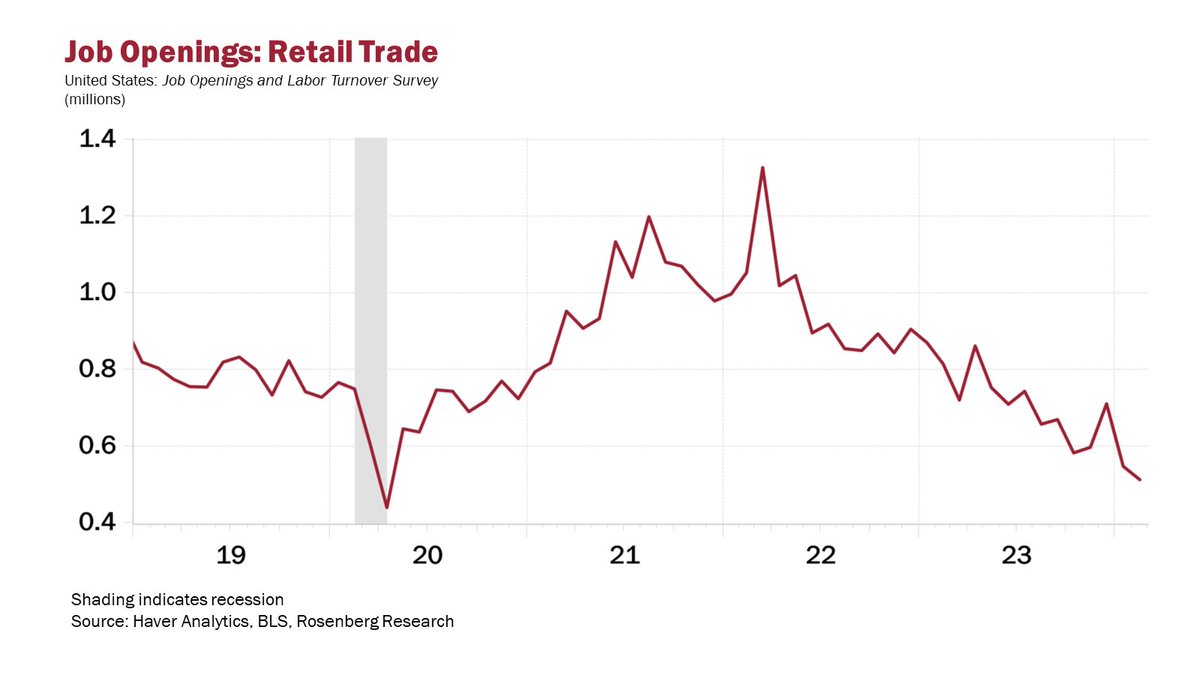
Looking at yesterday’s JOLTS data, one can legitimately ask what it means for the consumer outlook when retailers reduce their job openings to a level that last occurred during the peak of the pandemic/lockdown recession.

Looking at yesterday’s JOLTS data, one can legitimately ask what it means for the consumer outlook when retailers reduce their job openings to a level that last occurred during the peak of the pandemic/lockdown recession.
account_circle
Anna Wong(@AnnaEconomist) 's Twitter Profile Photo

Why the unemployment rate can go up even if jobless claims remain low, in BLS own words: “The unemployment data derived from the household survey in no way depend upon the eligibility for or receipt of unemployment insurance benefits.”

If you also believe that immigration drive…

Why the unemployment rate can go up even if jobless claims remain low, in BLS own words: “The unemployment data derived from the household survey in no way depend upon the eligibility for or receipt of unemployment insurance benefits.” If you also believe that immigration drive…
account_circle
Anna Wong(@AnnaEconomist) 's Twitter Profile Photo

BLS has a very clear exposition of the household vs establishment survey now: bls.gov/web/empsit/ces…

There is a simple chart there that is very striking. No need to say more. It is amazing that markets are pricing in a no landing given this.

BLS has a very clear exposition of the household vs establishment survey now: bls.gov/web/empsit/ces… There is a simple chart there that is very striking. No need to say more. It is amazing that markets are pricing in a no landing given this.
account_circle