Rochester Office of Data Analytics & Performance
@InnovationROC
Expands the City of Rochester, NY's capacity for research, data analysis / reporting, program design / evaluation, and process re-engineering / digitization.
ID:956903823523631104
26-01-2018 14:57:04
119 Tweets
435 Followers
796 Following

Let us know what you'd like to see on a new City of Rochester website! cityofrochester.gov/websurvey
Also please share the survey! We want to hear from your friends and families too!
#cityofrochester #roc #website #feedback #onlineservices #survey


Grab some fresh produce at one of Monroe County's many farmer's market!
We put together this handy dashboard to see when and where markets will pop-up :) bit.ly/3NUpQ5q 🥦🍎🍅🫐🥑🍈
#roc #monroecounty #farmersmarket #fresh

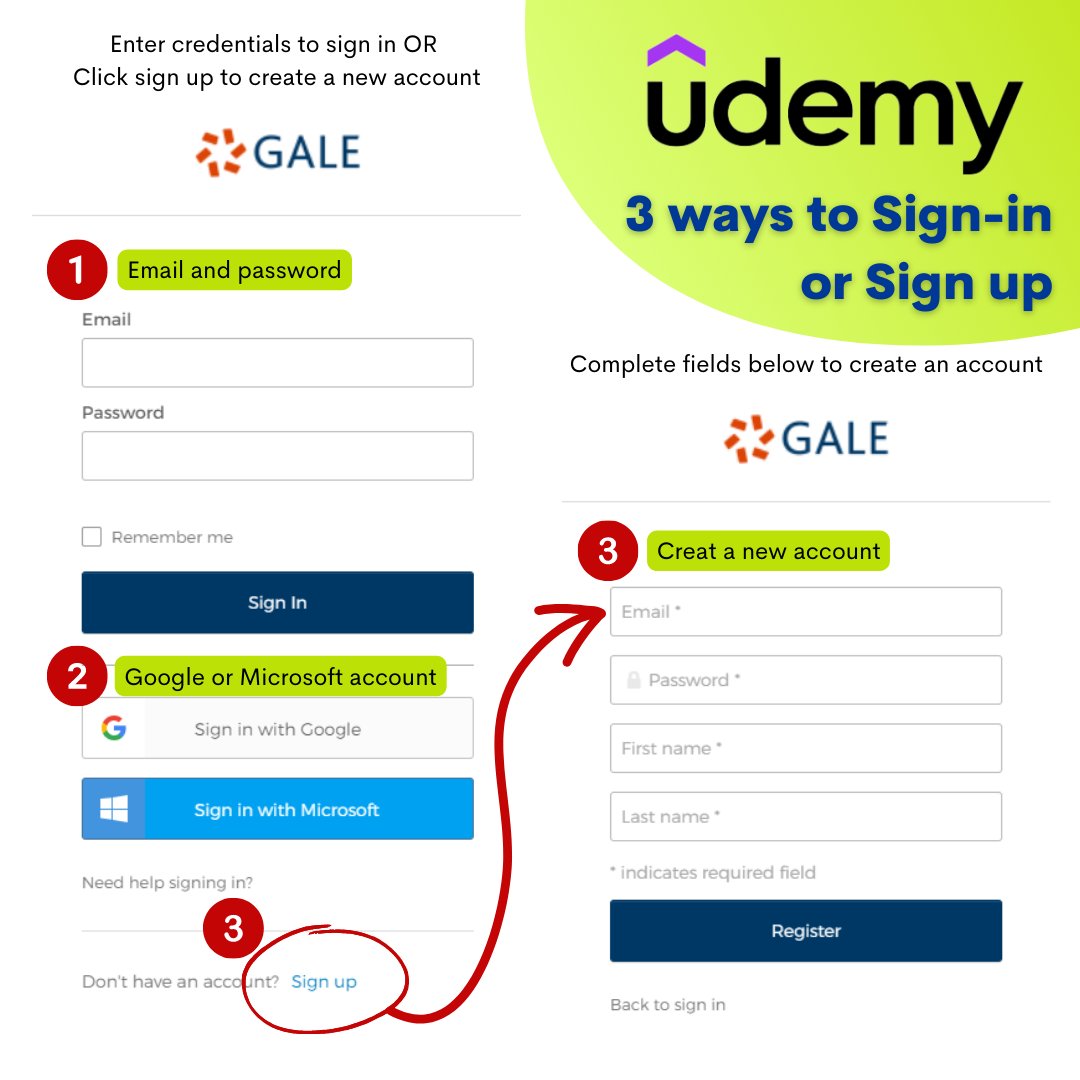
Quick reminder: Udemy is free for Rochester residents when you sign up with a Monroe County Library System library card!
#learning #udemy #onlinecourse #ROC


Our team was super excited to learn Rochester residents can access Udemy for free with their Monroe County Library System library card!
Check out our graphics on signing in through roccitylibrary.org/databases-rpl/
What are your favorite udemy courses? What should we take next?
#ROC #library #edu #free


Here's an opportunity for Rochester City Reserves families to get high speed internet and lower monthly bills!
Check out the link for details and to apply online 👇
You can also call with (877) 384-2575 questions and help applying!
#affordableconnectivity #ROC #digitalaccess

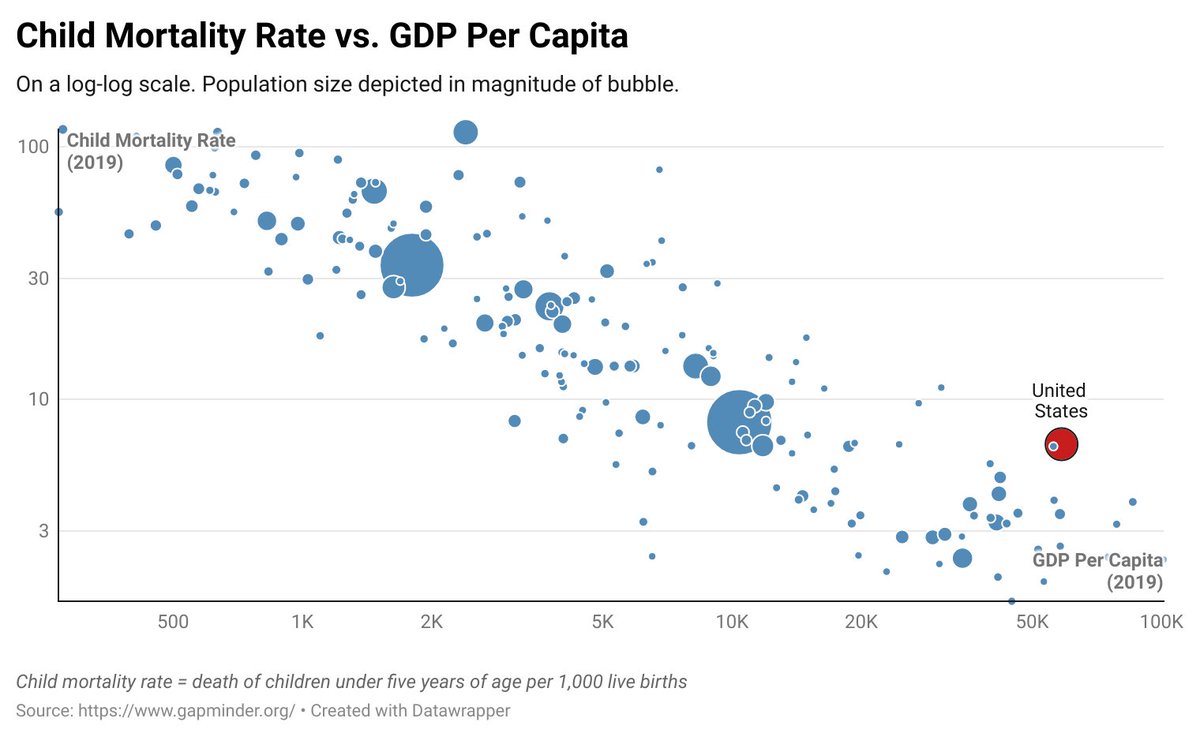
Playing catch-up for the #30DayChartChallenge . Day 23 and 30 - Tiles comparing regions' historical and predicted under-5yrs mortality rates. Thank you advancements in medical science!


Along with CASH Rochester, City of Rochester NY is proud to share stories from the What Works Cities Economic Mobility Initiative.
We were honored to be 1 of the 9 dedicated cities in this cohort pursuing better outcomes for residents.
More info> bit.ly/3vxHEv7

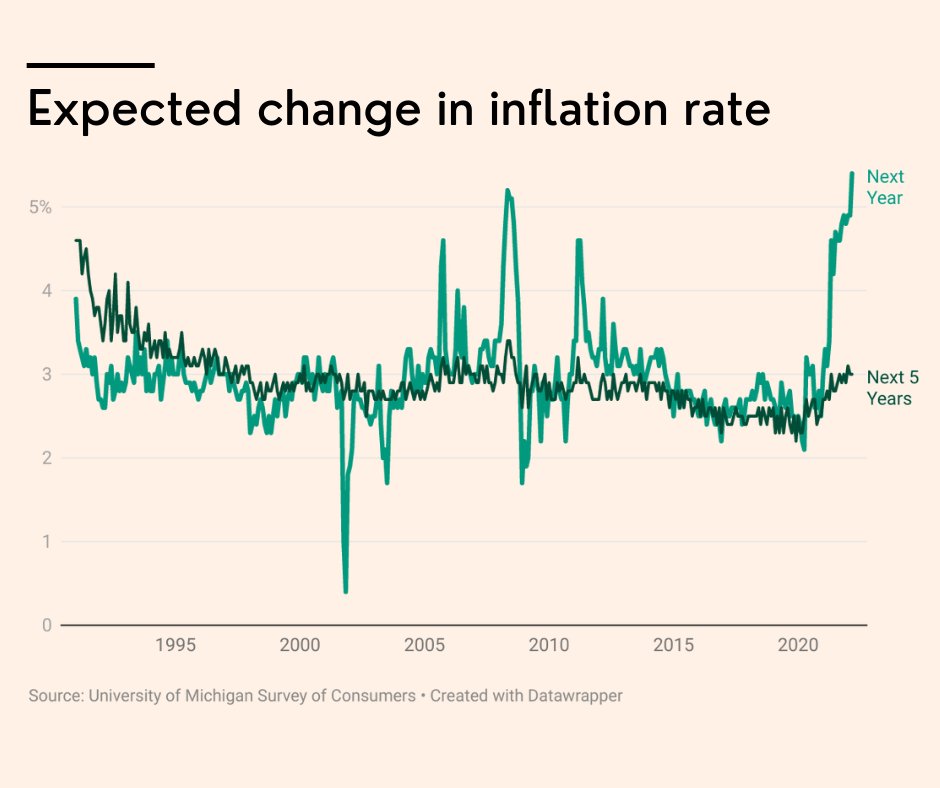
#30DayChartChallenge - Behind on #day24 (Financial Times - Financial Times style) and ahead on #day27 ( #future ):
University of Michigan's Surveys of Consumers - Expectations for #inflation rate in the next 1 and 5 years.
#data #data viz
datawrapper.de/_/HY9mz/

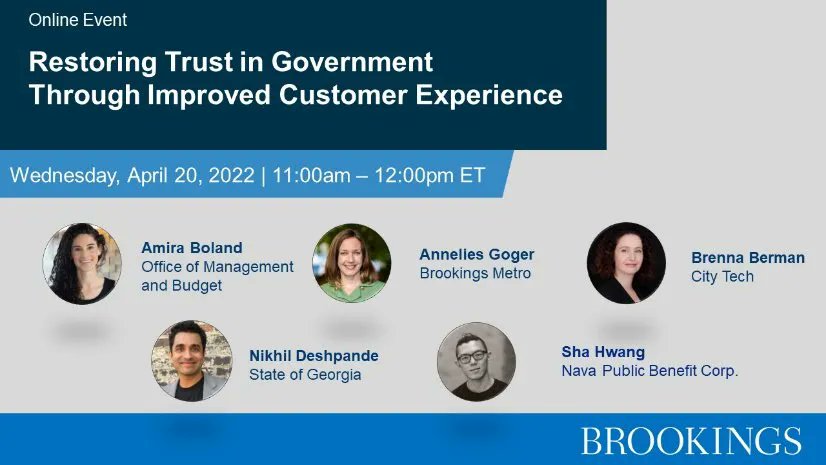
There's still time to join us to chat about improved user experience in #GovtServices with Amira Boland @annelies_goger Brenna Berman Nikhil Deshpande and [email protected]. Hosted by Brookings Metro. Starting in 30 mins: buff.ly/38T5B8w


#30DayChartChallenge Day 12
Doing our best to emulate the iconic visual style of The Economist
Data from University of Michigan's Surveys of Consumers, showing their Index of Consumer Sentiment broken out by age subgroups, charted by quarter.
#dataviz


#30DayChartChallenge Slightly late on #Day10
Topic: 'experimental'
Did some quick #textmining in #R using the classic book about an experiment, Frankenstein by Marry Shelly. Plotted the 40 most frequently used words in the text.


#30DayChartChallenge #Day9
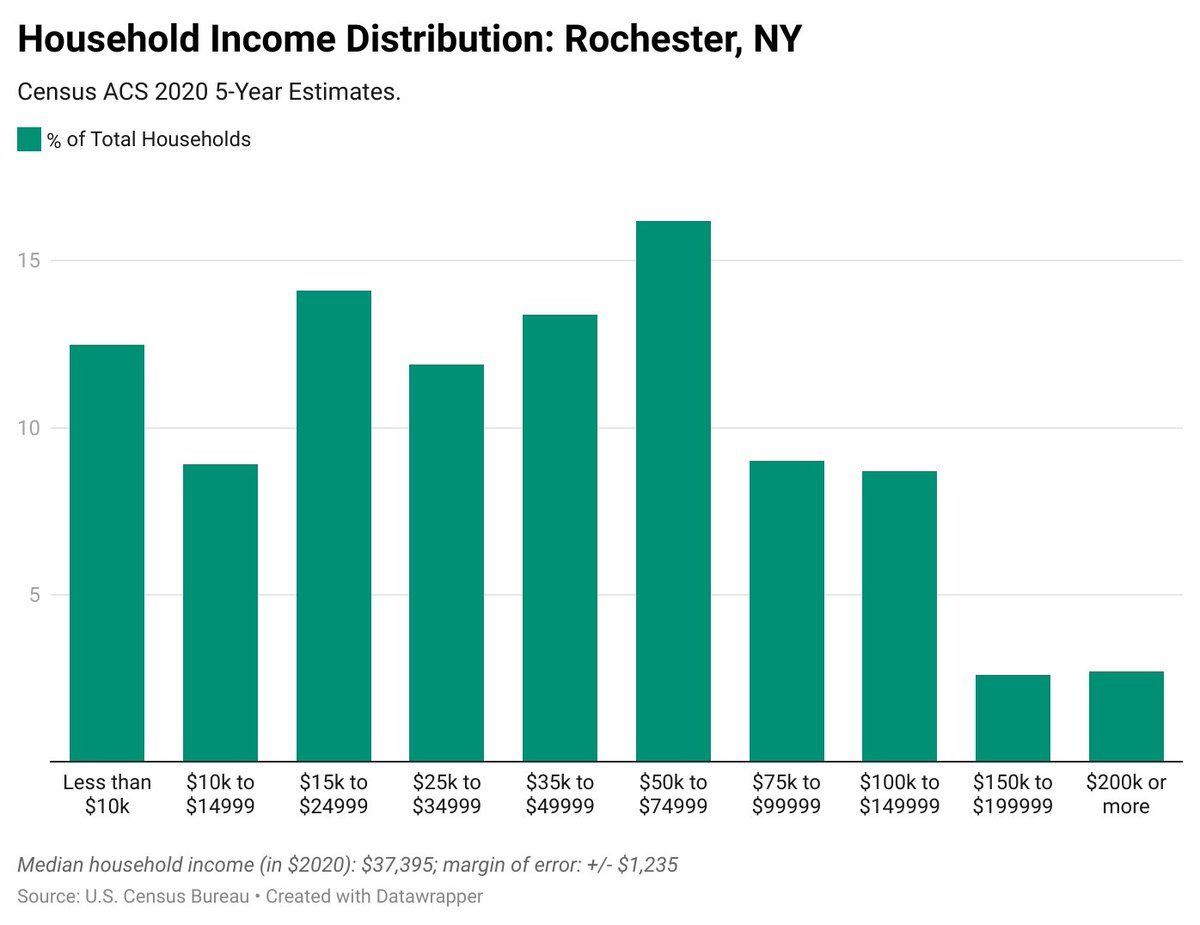
Today's chart features U.S. Census Bureau #statistics for household income in Rochester, NY.
Median household income for 2020: $37,395
Link to chart: datawrapper.dwcdn.net/jV8Ag/2/

Took a look at some BEA News data on our region for Day 8 of the #30DayChartChallenge ! These ended up looking more like mesas than mountains, but its still interesting to see the change in jobs & compensation over the past 20 years.
#rochester #dataviz #powerbi #canva


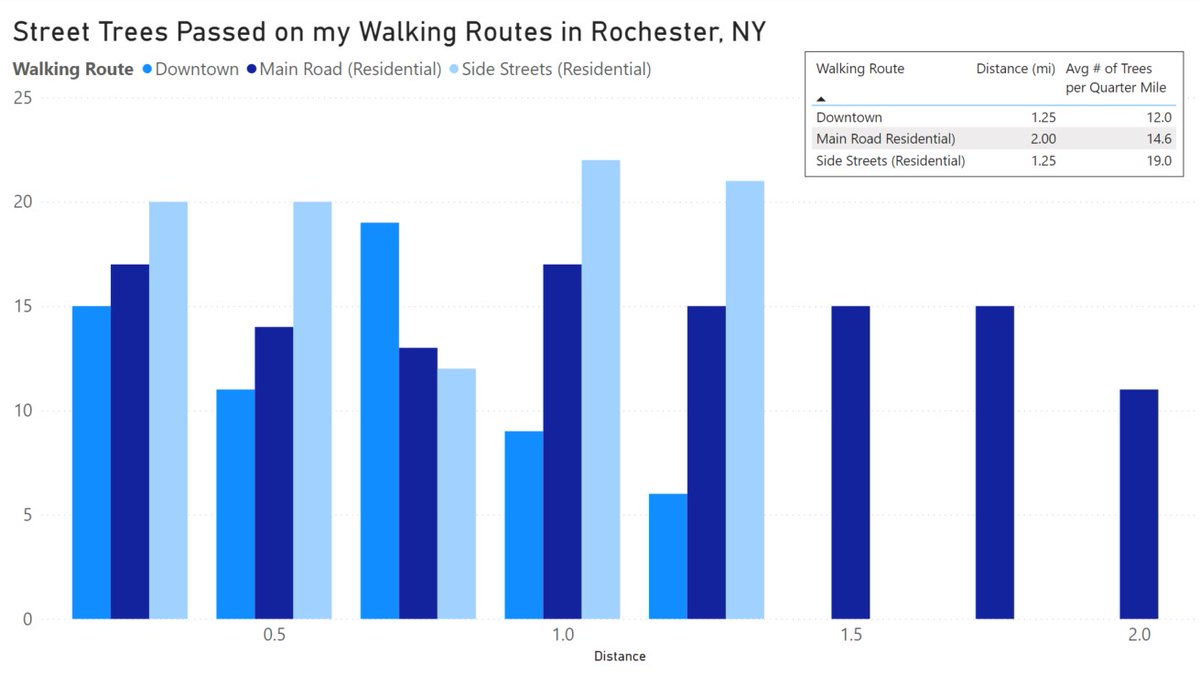
#Day7 of the #30DayChartChallenge . For this challenge one of our employees counted the street trees they pass on their walks through Rochester and compared the number of trees in different city settings in quarter mile increments. #Rochester #PowerBI #datanerds #streettrees

#30DayChartChallenge #DAY6
Data from Our World in Data
Today's chart: the young, working-age, and elderly population shares in the US from 1950, running through UN's projected figures for 2100, following their medium-growth scenario.
Chart link: datawrapper.dwcdn.net/LFUGK/1/

