World Climate Service
@worldclimatesvc
Insight and tools for long-range forecasting: objective seasonal and subseasonal prediction. Tweets by Prescient Weather cofounder Richard James, PhD
ID: 951558104054935553
http://www.worldclimateservice.com 11-01-2018 20:55:05
2,2K Tweet
8,8K Takipçi
977 Takip Edilen
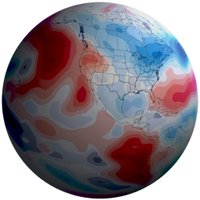
 on Twitter photo Interesting to see Arctic high pressure building in successive CFSv2 forecasts for January, as the model increasingly captures current MJO and stratosphere events.
(These maps are based on 10-day sets of initializations. Copernicus uses the entire previous month of model runs.)")
 on Twitter photo The 35-day GEFS is certainly producing some \"interesting\" MJO solutions")
 on Twitter photo Quite excited about this: MJO forecast from the AIFS-ENS, including an in-house 28-day extension.
Preliminary skill results are *very* interesting.
Available soon to customers.")
Declining weather observations in Alaska: a UA Fairbanks project shows the number of FAA/NWS sites reporting consistently (hourly) in Alaska has dropped about 40% in the last decade. Less than 20 off-road-network sites remain reliable. uaf-accap.org/projects/alask…
 on Twitter photo Declining weather observations in Alaska: a <a href=\"/uafairbanks/\">UA Fairbanks</a> project shows the number of FAA/NWS sites reporting consistently (hourly) in Alaska has dropped about 40% in the last decade. Less than 20 off-road-network sites remain reliable.
uaf-accap.org/projects/alask…")
 on Twitter photo The SW Pacific has taken over from the NW Pacific with the most pronounced marine heatwave in the global oceans.
The location of the anomaly is quite typical for La Niña, but the amplitude is extreme.")
 on Twitter photo The north-south MSLP difference across Alaska is about 60mb this afternoon, thanks to the extraordinary Bering Sea ridge.
Such a strong pressure gradient has only been equaled a couple of times since 1950 (ERA5 data).
Similar extremes have become a bit less common, it seems.")
 on Twitter photo Dueling temperature anomalies across the Bering Strait this month: December >10°C above normal in eastern Siberia, >10°C below normal in NW Canada.
Month-to-date mean temps below -32°C in Northway AK and Mayo YT are the coldest since 1980/1983 respectively. No end in sight")
 on Twitter photo Thermometers dipped to -50°C and lower in parts of Canada's Yukon Territory this morning.
Cold? Yes. Historic? Certainly not. As one example, Mayo YT (-50°C/-59°F today) used to see -55°C/-67°F with some regularity before 1980.")
 on Twitter photo The N Hem high-latitude flow is about to see a striking reversal, with 10mb flow strengthening even as the Arctic troposphere becomes more blocked.
It's fun to glance at similar past years (few recent) based on the stratospheric change alone. N America pattern looks familiar...")
 on Twitter photo There is open water within about 400 miles of the North Pole tonight.
Santa's operation may have a problem in the coming years 🎅")
 on Twitter photo In-house extended AIFS showing more amplification today in its expected return to MJO phase 6-7 in mid-January 👀
Happy New Year to all")
 on Twitter photo Generational cold snap in Fairbanks, Alaska: the 8th day in a row with a daily min temp of -46°F (-43°C) or below today.
This hasn't happened since 1975, although Jan 1989 cold was more anomalous. Honorable mention: New Year's 1999-2000
Just like an old-fashioned La Niña winter")