Brett (@brett_ethm) 's Twitter Profile
Brett

@brett_ethm

Bitcoin since 2013 | Data nerd | Historical trend chartist

ID: 280579320

calendar_today11-04-2011 16:20:30

824 Tweet

1,1K Takipçi

3,3K Takip Edilen

₿rett (@brett_eth) 's Twitter Profile Photo

$DXY vs Fed Rate Cuts w/ Recession and w/o Recession The 1995 and 1998 rate cuts. This is the cycle many of the bulls have said we are in. The Fed cut rates to extend the economic expansion rather than fight a recession. The DXY fell initially but rebounded as the cuts

$DXY vs Fed Rate Cuts w/ Recession and w/o Recession 

The 1995 and 1998 rate cuts. This is the cycle many of the bulls have said we are in. The Fed cut rates to extend the economic expansion rather than fight a recession. The DXY fell initially but rebounded as the cuts
₿rett (@brett_eth) 's Twitter Profile Photo

Hurricane Milton just made history with sub 900mb. One of the most powerful hurricanes in history and it’s still 2 days out. We had construction projections under 12 feet of storm surge during Ian. Entire towns destroyed. I’m not one to panic. I was born in Florida and I’ve

₿rett (@brett_eth) 's Twitter Profile Photo

Stay updated with the direct impacts of Hurricane #Milton. These cameras are in Sarasota and Englewood, FL. Well done, ☈ Chris Jackson ☈. This is insanely helpful for us SWFL locals to see what's happening in real-time. hazcams.com #HurricaneMilton #Florida
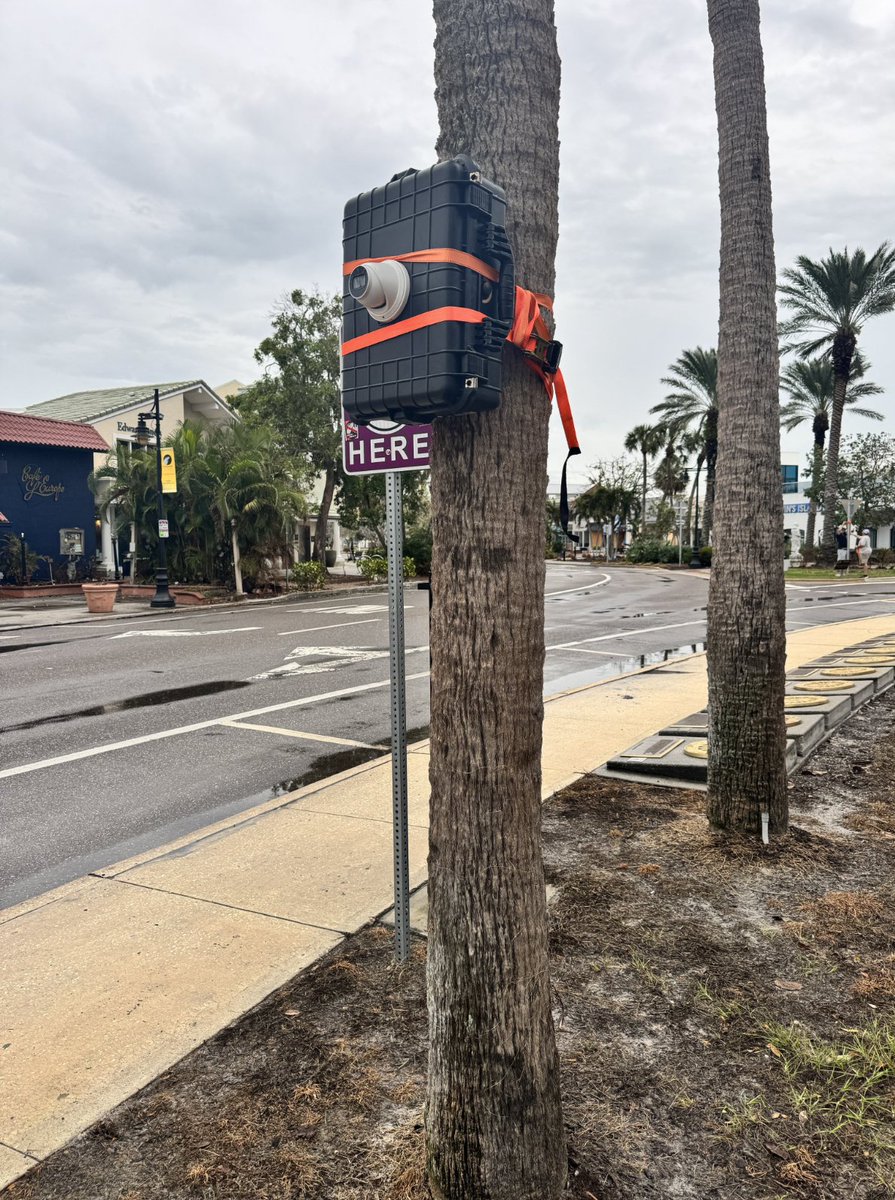
Stay updated with the direct impacts of Hurricane #Milton.  These cameras are in Sarasota and Englewood, FL. 

Well done, <a href="/ChrisJacksonSC/">☈ Chris Jackson ☈</a>. This is insanely helpful for us SWFL locals to see what's happening in real-time. 

hazcams.com

#HurricaneMilton #Florida
₿rett (@brett_eth) 's Twitter Profile Photo

$ETH continued. We're getting close to the bottom of the indicator range...however that doesn't always mean "bottom". Notice how some continue down after the indicator completed its cycle.

$ETH continued. We're getting close to the bottom of the indicator range...however that doesn't always mean "bottom". Notice how some continue down after the indicator completed its cycle.
₿rett (@brett_eth) 's Twitter Profile Photo

Your favorite CT influencer/kol: Last week: “#Bitcoin will hit $100,000 in Uptober.” Today: “I told you sub $60k $BTC is coming”

₿rett (@brett_eth) 's Twitter Profile Photo

$TSLA is a stock that won’t make you “get rich quick”, but your kids and grandkids will live an amazing life when they inherit it.

₿rett (@brett_eth) 's Twitter Profile Photo

$MSTR vs $BTC Summary: Just buy Microstrategy Bitcoin's daily candle has touched $62,000 40+ times since March. Study $MSTR during that same time frame. March 1: $103 May 6: $122 July 1: $137 August 2: $158 October 11: $205 #Bitcoin March 1: $62,000 May 6: $62,000 July 1:

$MSTR vs $BTC

Summary: Just buy Microstrategy

Bitcoin's daily candle has touched $62,000 40+ times since March.

Study $MSTR during that same time frame. 

March 1: $103
May 6: $122
July 1: $137
August 2: $158
October 11: $205

#Bitcoin
March 1: $62,000
May 6: $62,000
July 1:
₿rett (@brett_eth) 's Twitter Profile Photo

The $MSTR NAV Multiplier is very intriguing. MicroStrategy's stock price doesn’t just move 1-to-1 with the value of #Bitcoin like $iBit or other ETFs. Often, MSTR moves more aggressively, like a leveraged play on Bitcoin. If Bitcoin goes up by 1%, #MicroStrategy might go up by

The $MSTR NAV Multiplier is very intriguing. 

MicroStrategy's stock price doesn’t just move 1-to-1 with the value of #Bitcoin like $iBit or other ETFs. Often, MSTR moves more aggressively, like a leveraged play on Bitcoin. If Bitcoin goes up by 1%, #MicroStrategy might go up by
₿rett (@brett_eth) 's Twitter Profile Photo

Before I get the "but that was a black swan!!!" comments...let's just appreciate the similarities to date. No one here is predicting a COVID crash.