Aditya Dahiya (@adityadahiyaias) 's Twitter Profile
Aditya Dahiya

@adityadahiyaias

Reproducible code-based Data Visualizations. R. ggplot2. Views are personal.

ID: 1496558364788101120

linkhttps://aditya-dahiya.github.io/projects_presentations/projects.html calendar_today23-02-2022 18:51:41

124 Tweet

185 Takipçi

127 Takip Edilen

Aditya Dahiya (@adityadahiyaias) 's Twitter Profile Photo

#dataviz animated choropleth map of GDP per Capita in Europe (1981-2022) using Maddison Project Database. Data: jan luiten van zanden & Jutta Bolt UCGroningen; D.I.P. by Jeremy Singer-Vine Code🔗tinyurl.com/viz-an-cplth Tools #rstats #ggplot2 #gganimate #scales by Thomas Lin Pedersen & Hadley Wickham

Aditya Dahiya (@adityadahiyaias) 's Twitter Profile Photo

#dataviz🎯 Who's gaming the H1B visa lottery? See how applicants & firms are📈raising success rates with multiple applications. Data: Eric Fan at Bloomberg; USCIS Code🔗tinyurl.com/h1b-fix Tools #rstats #ggplot2 #tidyverse #H1BVisa #Immigration #opendata

#dataviz🎯 Who's gaming the H1B visa lottery? See how applicants & firms are📈raising success rates with multiple applications. 
Data: <a href="/ericfan_journo/">Eric Fan</a> at <a href="/Bloomberg/">Bloomberg</a>; <a href="/USCIS/">USCIS</a>
Code🔗tinyurl.com/h1b-fix
Tools #rstats #ggplot2 #tidyverse
#H1BVisa #Immigration #opendata
Aditya Dahiya (@adityadahiyaias) 's Twitter Profile Photo

#DataViz driving times🚗from New Delhi's Airport📍using #OpenSource data from Stadia Maps & openrouteservice.org (ORS), inspired from Milos Makes Maps. Code & Interactive version🔗tinyurl.com/del-airport Tools Leaflet, #rstats, #ggplot2, #ggmap by David Kahle, #maptiles by rlg & Nicolas Lambert

#DataViz driving times🚗from New Delhi's Airport📍using #OpenSource data from <a href="/StadiaMaps/">Stadia Maps</a> &amp; <a href="/ors_news/">openrouteservice.org (ORS)</a>, inspired from <a href="/milos_agathon/">Milos Makes Maps</a>.
Code &amp; Interactive version🔗tinyurl.com/del-airport
Tools <a href="/LeafletJS/">Leaflet</a>, #rstats, #ggplot2, #ggmap by <a href="/davidjkahle/">David Kahle</a>, #maptiles by <a href="/_rlg/">rlg</a> &amp; <a href="/neocartocnrs/">Nicolas Lambert</a>
Aditya Dahiya (@adityadahiyaias) 's Twitter Profile Photo

#TidyTuesday Wildlife in U.S. National Parks - a hierarchical donut #Taxonomy chart of species' numbers by Category, Order, Family, & Genus. Data: National Park Service Frank Hull 🍥 Code🔗tinyurl.com/tidy-hd Tools #Rstats #ggplot2 #tidyverse #dataviz #biodiversity #conservation

#TidyTuesday Wildlife in U.S. National Parks - a hierarchical donut #Taxonomy chart of species' numbers by Category, Order, Family, &amp; Genus. 
Data: <a href="/NatlParkService/">National Park Service</a> <a href="/frankiethull/">Frank Hull 🍥</a>
Code🔗tinyurl.com/tidy-hd
Tools #Rstats #ggplot2 #tidyverse
#dataviz #biodiversity #conservation
Aditya Dahiya (@adityadahiyaias) 's Twitter Profile Photo

#rstats A tutorial for computing shortest routes in the sea that avoid land, using #TidyTuesday data on Orcas in Salish Sea. Tutorial🔗 tinyurl.com/visage-sea-rou… Tools #rstats #ggplot2 {sf}, {terra} {geosphere}, {rgeoboundaries} by Dan Miller Runfola, {tidyterra} by dieghernan ن {gdistance}

#rstats A tutorial for computing shortest routes in the sea that avoid land, using #TidyTuesday data on Orcas in Salish Sea.
Tutorial🔗 tinyurl.com/visage-sea-rou…
Tools #rstats #ggplot2 {sf}, {terra} {geosphere}, {rgeoboundaries} by <a href="/geogdan/">Dan Miller Runfola</a>, {tidyterra} by <a href="/dhernangomez/">dieghernan ن</a> {gdistance}
Aditya Dahiya (@adityadahiyaias) 's Twitter Profile Photo

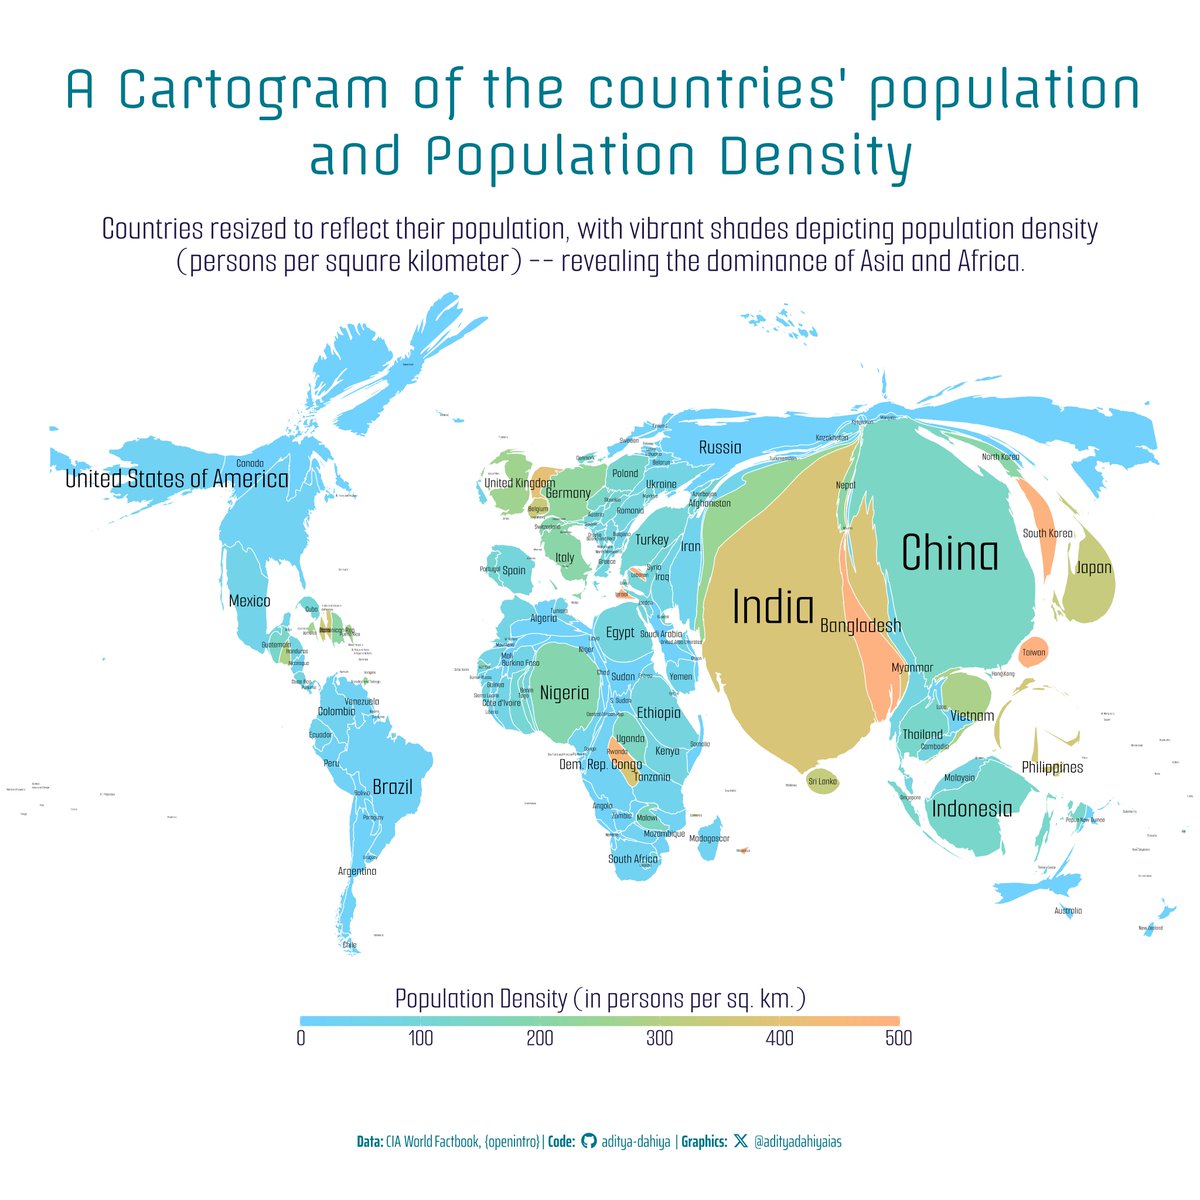
#TidyTuesday CIA World Factbook data on population and areas -- shown with a CARTOGRAM that distorts countries' area to reflect their total population. Data: CIA's World Factbook & OpenIntro Code 🔗 tinyurl.com/tidy-cia-carto… Tools #rstats #ggplot2 {cartogram} by S Jeworutzki

#TidyTuesday CIA World Factbook data on population and areas -- shown with a CARTOGRAM that distorts countries' area to reflect their total population.
Data: <a href="/CIA/">CIA</a>'s World Factbook &amp; <a href="/OpenIntroOrg/">OpenIntro</a> 
Code 🔗 tinyurl.com/tidy-cia-carto…
Tools #rstats #ggplot2 {cartogram} by S Jeworutzki
Aditya Dahiya (@adityadahiyaias) 's Twitter Profile Photo

#dataviz Step by step guide for making 3 types of Cartograms in R -- contiguous, non-contiguous and packed-circles -- using #TidyTuesday data. Data: OpenIntro CIA Code 🔗 tinyurl.com/r-cartograms Tools #rstats #sf {cartogram} by Sebastian Jeworutzki, {ggrepel} by Kamil Slowikowski

#dataviz Step by step guide for making 3 types of Cartograms in R -- contiguous, non-contiguous and packed-circles -- using #TidyTuesday data.
Data: <a href="/OpenIntroOrg/">OpenIntro</a> <a href="/CIA/">CIA</a> 
Code 🔗 tinyurl.com/r-cartograms
Tools #rstats #sf {cartogram} by Sebastian Jeworutzki, {ggrepel} by <a href="/slowkow/">Kamil Slowikowski</a>
Aditya Dahiya (@adityadahiyaias) 's Twitter Profile Photo

#dataviz How to plot Driving Directions using Open Street Maps Routing Service in R Data: OpenStreetMap openrouteservice.org (ORS) Code 🔗 tinyurl.com/open-drive-maps Tools #rstats #ggplot2 #sf, {tidygeocoder} by Jesse Cambon dieghernan ن, {osrm}, {ggmap} by David Kahle
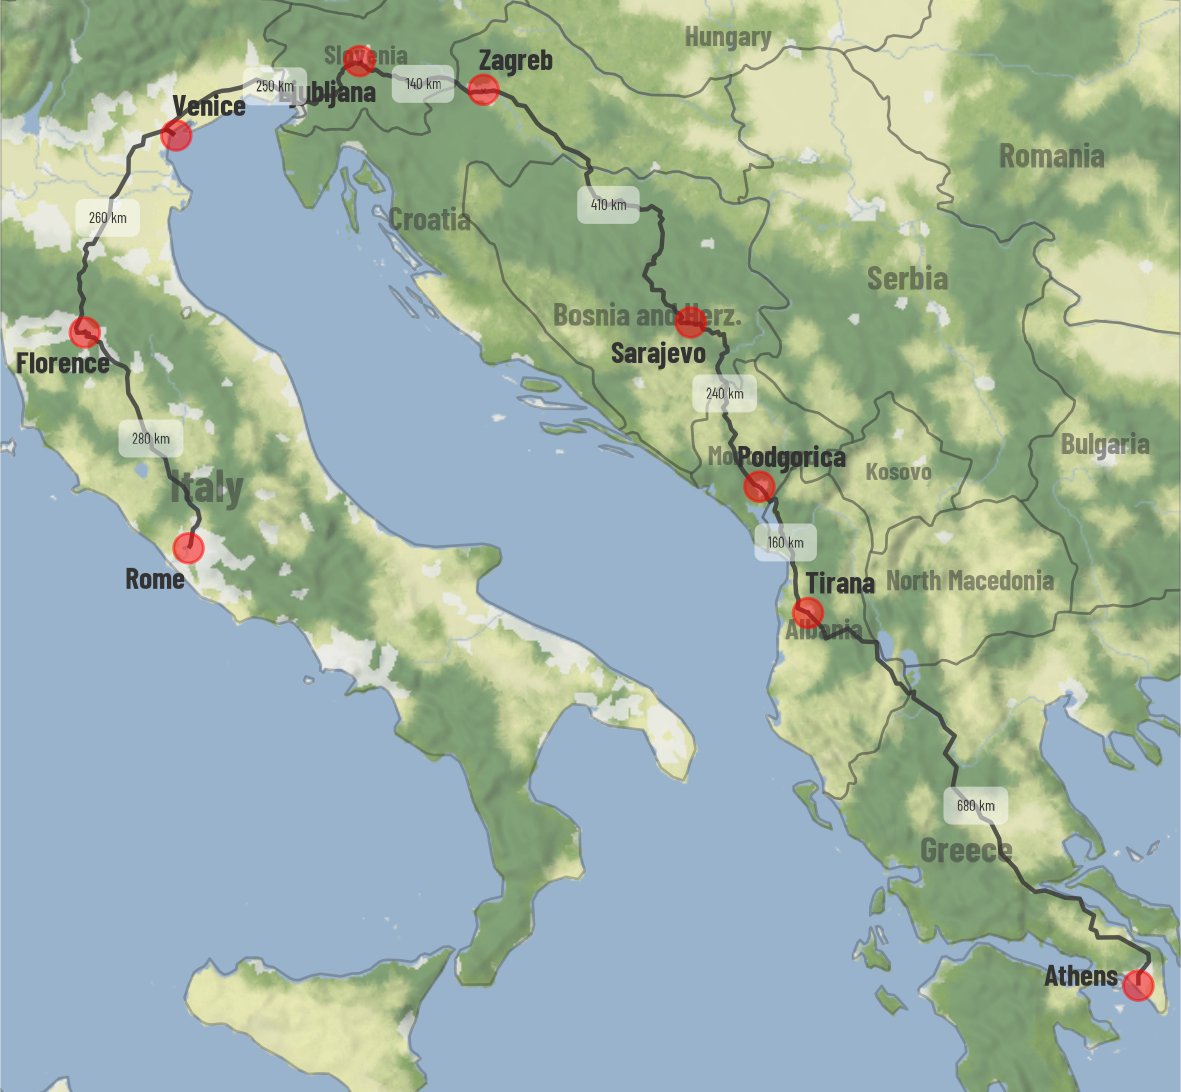
#dataviz How to plot Driving Directions using Open Street Maps Routing Service in R
Data: <a href="/openstreetmap/">OpenStreetMap</a> <a href="/ors_news/">openrouteservice.org (ORS)</a> 
Code 🔗 tinyurl.com/open-drive-maps
Tools #rstats #ggplot2 #sf, {tidygeocoder} by <a href="/JesseCambon/">Jesse Cambon</a> <a href="/dhernangomez/">dieghernan ن</a>, {osrm}, {ggmap} by <a href="/davidjkahle/">David Kahle</a>
Aditya Dahiya (@adityadahiyaias) 's Twitter Profile Photo

#TidyTuesday 👹a network graph of "monster" movie titles reveals eerie connections like Loch Ness etc. Data: IMDb & Jon Harmon (he/him) Code 🔗 tinyurl.com/tidy-monsters Tools #rstats #ggplot2, #tidygraph #ggraph by Thomas Lin Pedersen #dataviz

#TidyTuesday 👹a network graph of "monster" movie titles reveals eerie connections like Loch Ness etc.
Data: <a href="/IMDb/">IMDb</a> &amp; <a href="/JonTheGeek/">Jon Harmon (he/him)</a>
Code 🔗 tinyurl.com/tidy-monsters
Tools #rstats #ggplot2, #tidygraph #ggraph by <a href="/thomasp85/">Thomas Lin Pedersen</a>
#dataviz
Aditya Dahiya (@adityadahiyaias) 's Twitter Profile Photo

#TidyTuesday🌍📊 A World Transformed: 1950 to 2020: a flags' chart for how global political regimes have shifted ! Data: C. Bjørnskov & M. Rode's paper in Xavier Marquez's {democracyData} thru Jon Harmon (he/him) Code 🔗 tinyurl.com/tidy-democracy Tools #rstats #ggplot2 #ggflags

#TidyTuesday🌍📊 A World Transformed: 1950 to 2020: a flags' chart for how global political regimes have shifted !
Data: C. Bjørnskov &amp; M. Rode's paper in <a href="/marquezxavier/">Xavier Marquez</a>'s {democracyData} thru <a href="/JonTheGeek/">Jon Harmon (he/him)</a>
Code 🔗 tinyurl.com/tidy-democracy
Tools #rstats #ggplot2 #ggflags
Aditya Dahiya (@adityadahiyaias) 's Twitter Profile Photo

#TidyTuesday A world map of ISO-3166 Alpha-2 and Alpha-3 codes with #ggplot2 and #sf in #R. Data: {ISOcodes} by Christian Buchta & Kurt Hornik Code: 🔗 tinyurl.com/tidy-iso-codes Tools: #rstats #dataviz #sf #ggplot2

#TidyTuesday A world map of ISO-3166 Alpha-2 and Alpha-3 codes with #ggplot2 and #sf in #R.
Data: {ISOcodes} by Christian Buchta &amp; Kurt Hornik
Code: 🔗 tinyurl.com/tidy-iso-codes
Tools: #rstats #dataviz #sf #ggplot2
Aditya Dahiya (@adityadahiyaias) 's Twitter Profile Photo

An example with tutorial for topological relations in #R using #sf and #tidyverse: st_intersects() and its family of functions. #geocomputation #spatial Code 🔗 aditya-dahiya.github.io/visage/geocomp…

An example with tutorial for topological relations in #R using #sf and #tidyverse: st_intersects() and its family of functions.  #geocomputation #spatial 

Code 🔗 aditya-dahiya.github.io/visage/geocomp…
Aditya Dahiya (@adityadahiyaias) 's Twitter Profile Photo

#dataviz A tutorial on combining powers of #sf st_is_within_distance(), #osmr osmRoute() and #ggimage get_stadia_map() to get locations of stores that fall on a route. Tutorial Code 🔗 tinyurl.com/sf-st-dist Tools #rstats #ggplot2 {sf} {osmr} {ggmap} by openrouteservice.org (ORS) OpenStreetMap

#dataviz A tutorial on combining powers of #sf st_is_within_distance(), #osmr osmRoute() and #ggimage get_stadia_map() to get locations of stores that fall on a route.
Tutorial Code 🔗 tinyurl.com/sf-st-dist
Tools #rstats #ggplot2 {sf} {osmr} {ggmap} by <a href="/ors_news/">openrouteservice.org (ORS)</a> <a href="/openstreetmap/">OpenStreetMap</a>
Aditya Dahiya (@adityadahiyaias) 's Twitter Profile Photo

#TidyTuesday using {gghalves} to make half-violin haf-dotplots for evolution of puntuations in Bob's Burgers episodes' dialogues. Data: {bobsburgersR} by Steven Ponce Code 🔗 tinyurl.com/tidy-burgers Tools: #rstats #ggplot2 #gghalves by Frederik Tiedemann

#TidyTuesday using {gghalves} to make half-violin haf-dotplots for evolution of puntuations in <a href="/BobsBurgersFOX/">Bob's Burgers</a> episodes' dialogues.
Data: {bobsburgersR} by <a href="/sponce1/">Steven Ponce</a> 
Code 🔗 tinyurl.com/tidy-burgers
Tools: #rstats #ggplot2 #gghalves by Frederik Tiedemann
Aditya Dahiya (@adityadahiyaias) 's Twitter Profile Photo

#dataviz A detailed tutorial and project on mapping health-facilties, highways and their proximity with #R and #sf geo-computation. Data: OpenStreetMap Survey of India Code 🔗 tinyurl.com/health-highway Tools #rstats #ggplot2 {sf} {ggspatial} {osmdata} by rOpenSci

#dataviz A detailed tutorial and project on mapping health-facilties, highways and their proximity with #R and #sf geo-computation.
Data: <a href="/openstreetmap/">OpenStreetMap</a> <a href="/india_soi/">Survey of India</a> 
Code 🔗 tinyurl.com/health-highway
Tools #rstats #ggplot2 {sf} {ggspatial} {osmdata} by <a href="/rOpenSci/">rOpenSci</a>
Aditya Dahiya (@adityadahiyaias) 's Twitter Profile Photo

#TidyTuesday U.S. Border Encounters (2020–2024) with a ribbon chart. 2024 saw "illegal crossings between ports" surge past "denials at official ports". Data: Tony Galvan CBP North America Code 🔗 tinyurl.com/tidy-us-border Tools: #rstats #ggplot2, {ggbraid} by Neal Grantham 🆖

#TidyTuesday U.S. Border Encounters (2020–2024) with a ribbon chart. 2024 saw "illegal crossings between ports" surge past "denials at official ports".
Data: <a href="/GDataScience1/">Tony Galvan</a> <a href="/CBPNorthAmerica/">CBP North America</a>
Code 🔗 tinyurl.com/tidy-us-border
Tools: #rstats #ggplot2, {ggbraid} by <a href="/nsgrantham/">Neal Grantham 🆖</a>