Jurrien Timmer (@timmerfidelity) 's Twitter Profile
Jurrien Timmer

@timmerfidelity

Dir. of Global Macro @Fidelity. Student of history, chart maker, cyclist, cook. Helping investors break thru the clutter. Views are mine. fidelity.com/socialAM

ID: 2918307101

linkhttp://www.fidelity.com calendar_today12-12-2014 19:50:49

14,14K Tweet

198,198K Takipçi

1,1K Takip Edilen

Jurrien Timmer (@timmerfidelity) 's Twitter Profile Photo

The Tariff Tantrum of the past few months has produced a rapid repricing of US vs ex-US equities. That 68% P/E premium in February is now 50% as international earnings estimates are now outpacing US estimates.

The Tariff Tantrum of the past few months has produced a rapid repricing of US vs ex-US equities. That 68% P/E premium in February is now 50% as international earnings estimates are now outpacing US estimates.
Jurrien Timmer (@timmerfidelity) 's Twitter Profile Photo

While the US continues to trade at a substantial premium, one could argue that this is justified based on superior historical earnings growth and higher payouts. That’s what the chart below shows. Were that to change, then the math will change with it.

While the US continues to trade at a substantial premium, one could argue that this is justified based on superior historical earnings growth and higher payouts.  That’s what the chart below shows. Were that to change, then the math will change with it.
Jurrien Timmer (@timmerfidelity) 's Twitter Profile Photo

One very large question hanging over the markets is whether we are entering a new structural era in which the world deglobalizes and de-dollarizes, and in which the pendulum between labor and capital swings towards labor. I don’t have a good way to depict this pendulum, but the

One very large question hanging over the markets is whether we are entering a new structural era in which the world deglobalizes and de-dollarizes, and in which the pendulum between labor and capital swings towards labor. I don’t have a good way to depict this pendulum, but the
Jurrien Timmer (@timmerfidelity) 's Twitter Profile Photo

Dinner for one, California style: seared tuna with crispy kale on little gems tossed with a kewpie-soy dressing. Served with a local PN.

Dinner for one, California style: seared tuna with crispy kale on little gems tossed with a kewpie-soy dressing.  Served with a local PN.
Jurrien Timmer (@timmerfidelity) 's Twitter Profile Photo

Tomorrow at 11am ET I’ll be joining Fidelity Digital Assets The Value Exchange with Chris Kuiper, CFA to discuss macro, money, and the role of bitcoin. Link to register for the webinar is below. See you then. go.fidelitydigitalassets.com/tve_macro_mone…

Jurrien Timmer (@timmerfidelity) 's Twitter Profile Photo

After a 21.5% decline in stock prices, when all US-denominated assets seemed to be on sale (except gold), the market has taken the glass-half-full approach that a trade war will be prevented. Indeed, looking at all analogs since 1900, once the stock market has declined 20% the

After a 21.5% decline in stock prices, when all US-denominated assets seemed to be on sale (except gold), the market has taken the glass-half-full approach that a trade war will be prevented. Indeed, looking at all analogs since 1900, once the stock market has declined 20% the
Jurrien Timmer (@timmerfidelity) 's Twitter Profile Photo

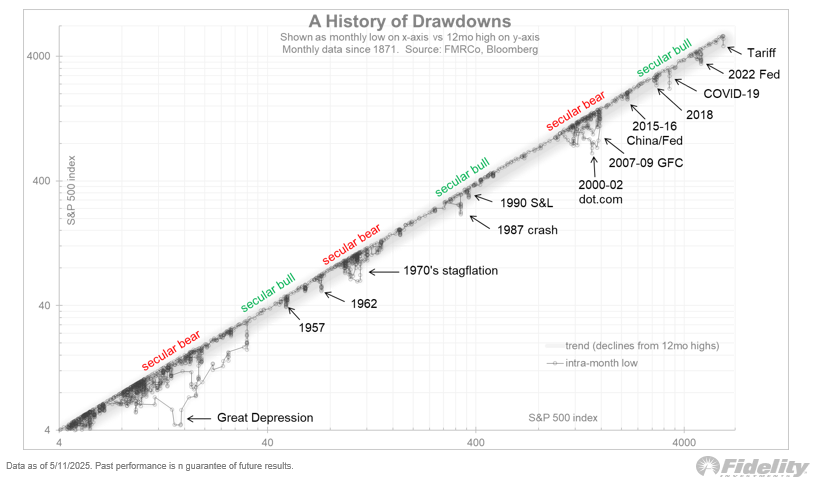
Taking about a thousand steps back, we can see that in the grand scheme of things, the current 22% correction is just a bump on the road. Yes, a 150-year timeframe is longer than we will be alive, but nevertheless it’s useful to zoom out to gain perspective.

Taking about a thousand steps back, we can see that in the grand scheme of things, the current 22% correction is just a bump on the road. Yes, a 150-year timeframe is longer than we will be alive, but nevertheless it’s useful to zoom out to gain perspective.
Jurrien Timmer (@timmerfidelity) 's Twitter Profile Photo

While 1998 and 2018 have been useful price analogs to gauge the psychology of the market, the 1968 analog continues to be a compelling alternative to the bullish implications of both 1998 and 2018. If your glass is half empty instead of half full, you will want to keep this

While 1998 and 2018 have been useful price analogs to gauge the psychology of the market, the 1968 analog continues to be a compelling alternative to the bullish implications of both 1998 and 2018. If your glass is half empty instead of half full, you will want to keep this
Jurrien Timmer (@timmerfidelity) 's Twitter Profile Photo

For the current cycle, knowing that equity valuations have gotten a decent haircut (from 23x to 19x), the big question remains how much earnings are at risk if the threat of a trade war turns into something worse. So far, the trailing EPS growth rate remains at +10%, but that

For the current cycle, knowing that equity valuations have gotten a decent haircut (from 23x to 19x), the big question remains how much earnings are at risk if the threat of a trade war turns into something worse. So far, the trailing EPS growth rate remains at +10%, but that
Jurrien Timmer (@timmerfidelity) 's Twitter Profile Photo

Earnings estimates for the coming quarters are coming down, but it remains unclear how much of this is related to the tariff tantrum and the risk of a recession and how much is just the usual downward drift. Taking a step back to look at 40 years of estimate history, the

Earnings estimates for the coming quarters are coming down, but it remains unclear how much of this is related to the tariff tantrum and the risk of a recession and how much is just the usual downward drift.

Taking a step back to look at 40 years of estimate history, the
Jurrien Timmer (@timmerfidelity) 's Twitter Profile Photo

While US earnings estimates are being marked down, EAFE estimates are being marked up. This finally creates a catalyst for the rest of the world (especially EAFE) to outperform the US for a cycle or more. That catalyst had been missing until recently. Below we see that EAFE

While US earnings estimates are being marked down, EAFE estimates are being marked up. This finally creates a catalyst for the rest of the world (especially EAFE) to outperform the US for a cycle or more. That catalyst had been missing until recently.  Below we see that EAFE
Jurrien Timmer (@timmerfidelity) 's Twitter Profile Photo

Technically speaking, the price action for US equities remains inconclusive in terms of whether the price recovery of the past few weeks is a continuation of the prevailing up-trend or a retracement within an unfolding bear market. We just don’t know yet, although the monthly

Technically speaking, the price action for US equities remains inconclusive in terms of whether the price recovery of the past few weeks is a continuation of the prevailing up-trend or a retracement within an unfolding bear market.  We just don’t know yet, although the monthly
Jurrien Timmer (@timmerfidelity) 's Twitter Profile Photo

As the chart below shows, if the mega-growth driven US secular bull market is indeed cresting, then there is room for international equities to outperform beyond just an earnings cycle. The same three decades-long super cycle (depicted as a 10-year relative CAGR in the bottom

As the chart below shows, if the mega-growth driven US secular bull market is indeed cresting, then there is room for international equities to outperform beyond just an earnings cycle. The same three decades-long super cycle (depicted as a 10-year relative CAGR in the bottom
Jurrien Timmer (@timmerfidelity) 's Twitter Profile Photo

If the secular tide is cresting, we will need to rethink the 60/40 paradigm that served us so well from the late 1990s until 2022. My sense is that we need to paint this canvas with broader strokes, emphasizing the alpha over the beta. Equities? Yes, of course. Bonds? Also, but

If the secular tide is cresting, we will need to rethink the 60/40 paradigm that served us so well from the late 1990s until 2022. My sense is that we need to paint this canvas with broader strokes, emphasizing the alpha over the beta. Equities? Yes, of course. Bonds? Also, but
Jurrien Timmer (@timmerfidelity) 's Twitter Profile Photo

When it comes to diversification, I am more concerned about hedging the 40 than the 60. Even if the secular wave turns for equities, my version of the CAPE model suggests that returns will stay positive (just less so). Plus, we can just rotate into international equities, which

When it comes to diversification, I am more concerned about hedging the 40 than the 60. Even if the secular wave turns for equities, my version of the CAPE model suggests that returns will stay positive (just less so).  Plus, we can just rotate into international equities, which
Jurrien Timmer (@timmerfidelity) 's Twitter Profile Photo

Below we see that there should be some alpha to harvest from a lower beta world. Alts, gold and Bitcoin all have sizeable Sharpe Ratios (risk-adjusted returns). And those same asset classes have low or even negative betas to the S&P 500.

Below we see that there should be some alpha to harvest from a lower beta world. Alts, gold and Bitcoin all have sizeable Sharpe Ratios (risk-adjusted returns).

And those same asset classes have low or even negative betas to the S&P 500.
Jurrien Timmer (@timmerfidelity) 's Twitter Profile Photo

I continue to be fascinated by the fact that the most negatively correlated asset to Bitcoin is gold. For two players on the same store-of-value team, it’s not what I would expect to see. But Bitcoin’s Dr. Jekyll & Mr. Hyde personality makes it an unpredictable asset class that

I continue to be fascinated by the fact that the most negatively correlated asset to Bitcoin is gold. For two players on the same store-of-value team, it’s not what I would expect to see. But Bitcoin’s Dr. Jekyll & Mr. Hyde personality makes it an unpredictable asset class that
Jurrien Timmer (@timmerfidelity) 's Twitter Profile Photo

After a strong run by gold, perhaps the baton is being passed again to Bitcoin, with Bitcoin back above $100k and the two Sharpe Ratios now converging. I still think a ratio of 4:1 (gold vs Bitcoin) makes sense in terms of how much gold vs Bitcoin might co-exist in a

After a strong run by gold, perhaps the baton is being passed again to Bitcoin, with Bitcoin back above $100k and the two Sharpe Ratios now converging. I still think a ratio of 4:1 (gold vs Bitcoin) makes sense in terms of how much gold vs Bitcoin might co-exist in a