JT (@tcmllc) 's Twitter Profile
JT

@tcmllc

Growth stock investor focused on finding the next SUPER WINNERS. 26 yrs experience, life long student, and founder of TickerMonkey.com traders community

ID: 32362720

linkhttp://www.tickermonkey.com calendar_today17-04-2009 10:29:59

23,23K Tweet

27,27K Takipçi

707 Takip Edilen

JT (@tcmllc) 's Twitter Profile Photo

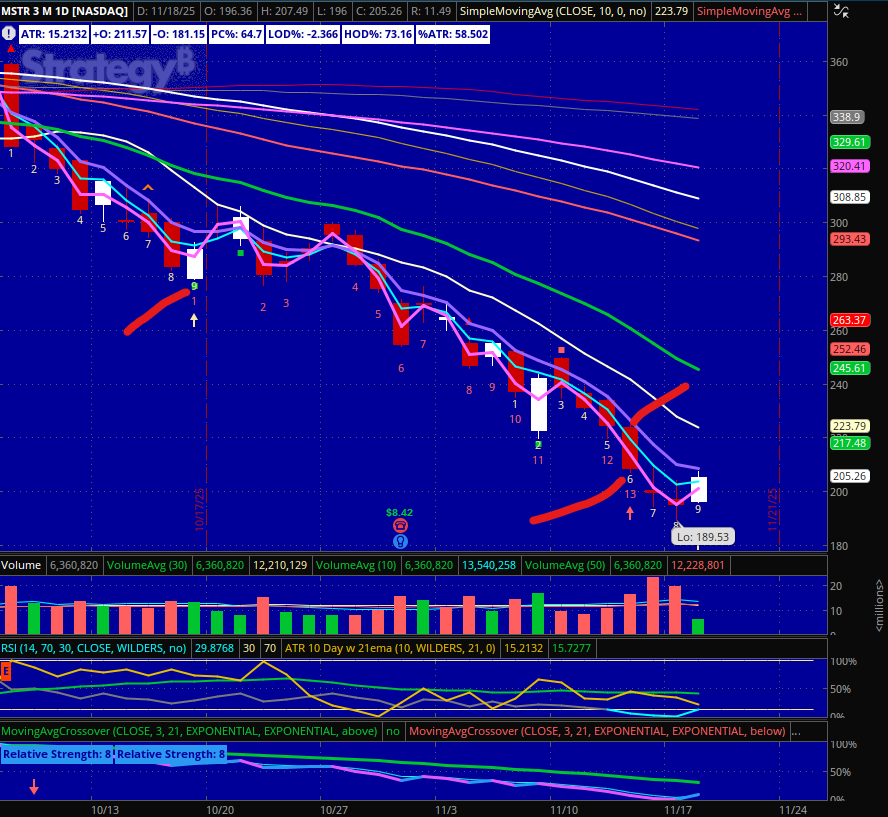
$MSTR the first Sequential 9 was on 10/17 with a 292.80 pivot at its HOD.  However, that same session started the Sequential 13 count which ended on 11/13 with a 226 HOD pivot. The low of that 13 at 207.03 is a pivot on a reclaim up at this point. In the process of that 13 count

$MSTR the first Sequential 9 was on 10/17 with a 292.80 pivot at its HOD.  However, that same session started the Sequential 13 count which ended on 11/13 with a 226 HOD pivot. The low of that 13 at 207.03 is a pivot on a reclaim up at this point.

In the process of that 13 count
JT (@tcmllc) 's Twitter Profile Photo

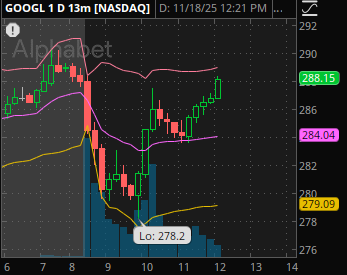
These VWAP continuation trades on the Core 7 names via the 13min are always something I watch for. $GOOGL has a textbook one today. It reclaimed VWAP after the Gemini 3 Pro news and then flagged back into VWAP for the continuation trade set up. Nice scallop / U turn up off.

These VWAP continuation trades on the Core 7 names via the 13min are always something I watch for.  $GOOGL has a textbook one today.  It reclaimed VWAP after the Gemini 3 Pro news and then flagged back into VWAP for the continuation trade set up.  Nice scallop / U turn up off.
JT (@tcmllc) 's Twitter Profile Photo

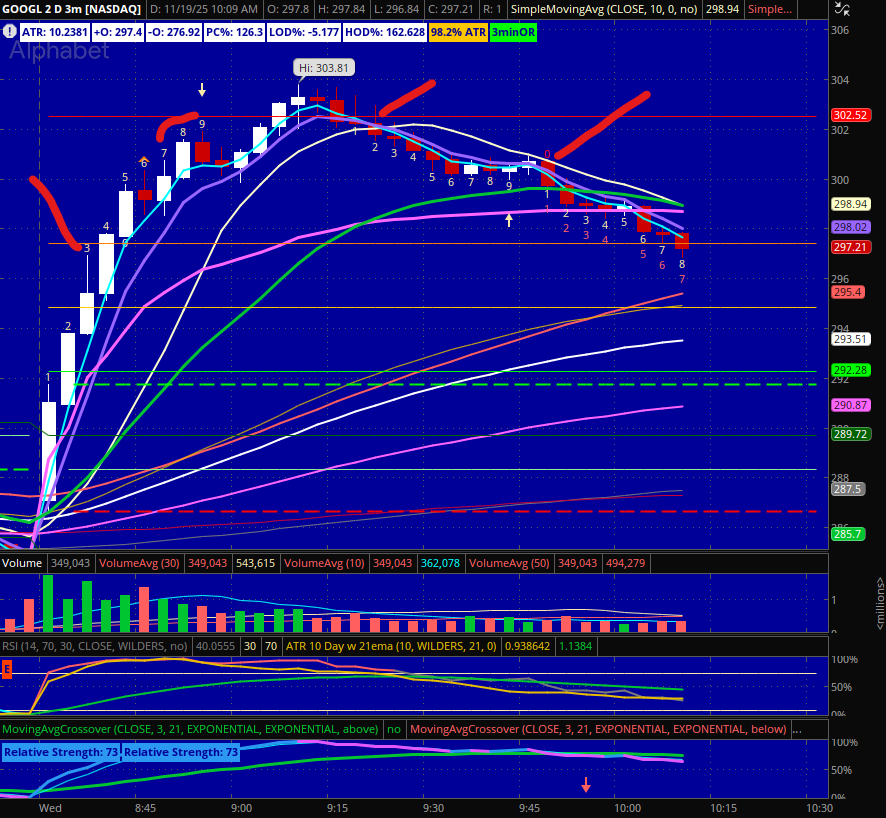
Went after GOOGL today off the open. I do these playbook trade reviews for myself and then forward to a channel we have in Slack called "playbook-trades." $GOOGL I jumped off too quickly as it jumped up quickly to 100% ATR.  My mistake was not watching the bar count.  It ran

Went after GOOGL today off the open. I do these playbook trade reviews for myself and then forward to a channel we have in Slack called "playbook-trades." 

$GOOGL I jumped off too quickly as it jumped up quickly to 100% ATR.  My mistake was not watching the bar count.  It ran
JT (@tcmllc) 's Twitter Profile Photo

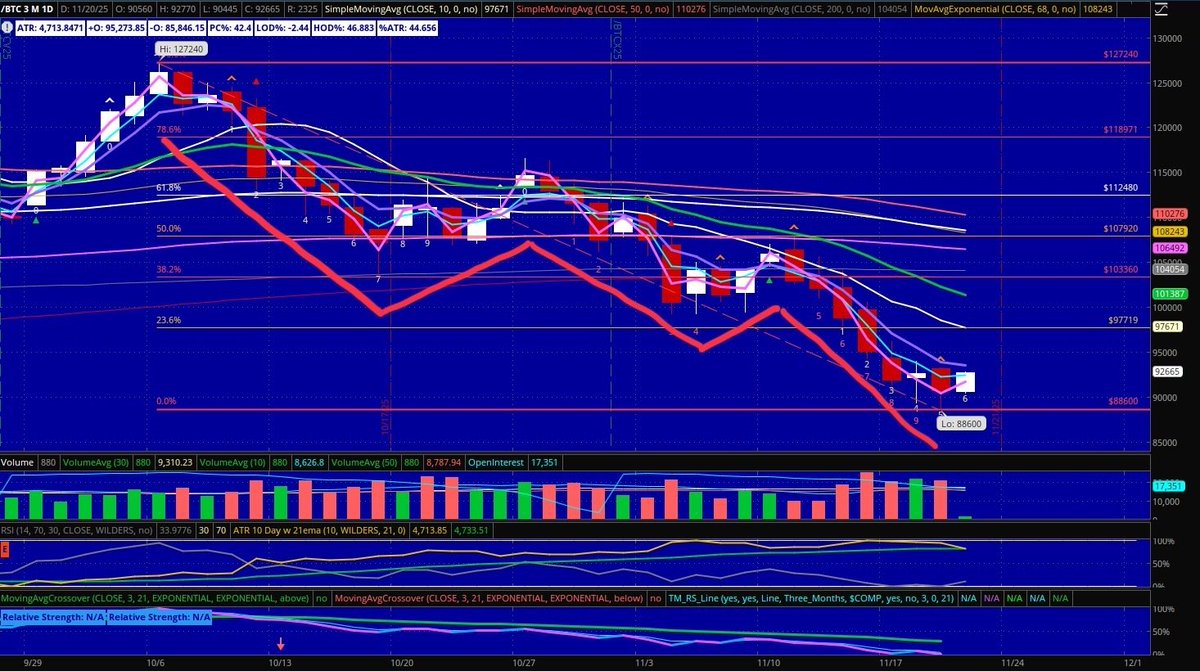
$BTC futures had a failed wick set up today that pushed down -96% ATR LOD for a marginal new low on this move. 3 waves down on the daily chart from the high potentially in place here for a bounce? Preference is to get the 3 waves down on a weekly chart. So on the weekly

$BTC futures had a failed wick set up today that pushed down -96% ATR LOD for a marginal new low on this move.  

3 waves down on the daily chart from the high potentially in place here for a bounce?  

Preference is to get the 3 waves down on a weekly chart. So on the weekly
JT (@tcmllc) 's Twitter Profile Photo

2nd OEL from $TSLA this week. Today an OEL + 3 bar break up so far. 64% ATR HOD now as it noses through 21ema on daily. If it went for 100% ATR up at 436.11 currently from the Open that would get it over the 50ma daily.

JT (@tcmllc) 's Twitter Profile Photo

$NAMO started the session -4 on the gap up and now with the Oops to Bearish Engulfing on $QQQ the NAMO -50 alarm just sounded. $NASI RSI 6.92

JT (@tcmllc) 's Twitter Profile Photo

BTC futures high was 127,240 Corrective levels to watch : -20%   101,792 -25%  95,430 -30%  89,068 -35%  82,706 -40%  76,344 The backwardation isn't huge as it is more flat vs a steep one. The tell will be when the curve steepens with a contango again. $BTC is this

JT (@tcmllc) 's Twitter Profile Photo

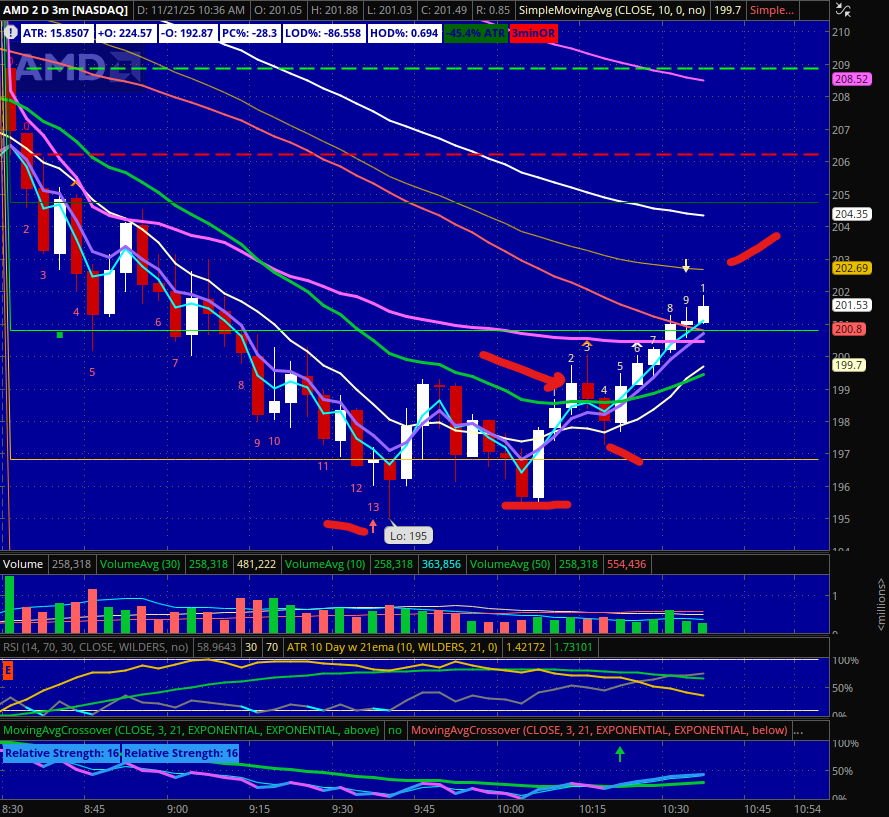
$AMD intraday trade on 3min 21ema crossover. 199.16 on the first Close over 3min 21ema and the ATR value was 1.80. ATR x 2 = 3.60 for R value. Stop is 195.56. -86% ATR LOD from Open and then a higher low. 1R Up at 202.76

JT (@tcmllc) 's Twitter Profile Photo

Here's how that $AMD trade framed up. 10bp risk was 5.5% AUM trade. Stop moved to b/e now so no risk. I sized it above the protocol so I right sized it when it moved up 2pts above entry. Now moving stop to b/e on the trade. Will take half off at 1R and then see if

Here's how that $AMD trade framed up.  

10bp risk was 5.5% AUM trade.  
Stop moved to b/e now so no risk.  

I sized it above the protocol so I right sized it when it moved up 2pts above entry.  

Now moving stop to b/e on the trade.  

Will take half off at 1R and then see if
JT (@tcmllc) 's Twitter Profile Photo

This is a great opportunity!!! And if you simply go for the 80% off sale, and start working with Brandon on custom scripts I'm sure he'd slide you some bonus ones too. He's already got an in depth library of FREE scripts and custom indicators you can benefit from.

JT (@tcmllc) 's Twitter Profile Photo

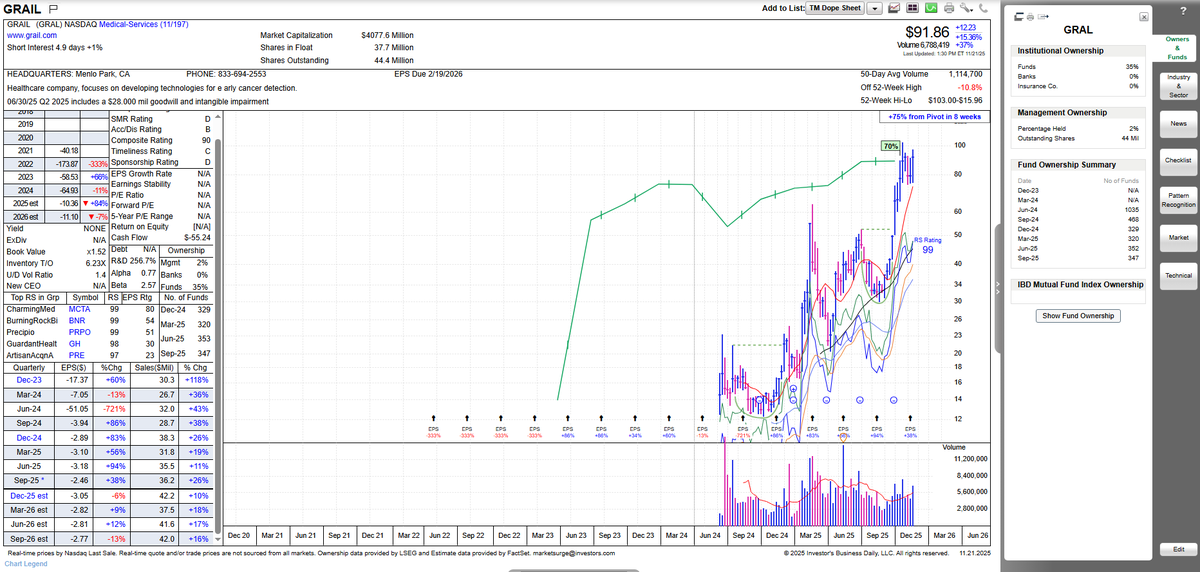
If you go to the maximum boundary of -28% then that gives you 74.16 and $GRAL high tight flag attempt put in a low at 74.  Good enough for ryan 📈⛳️ and gubment work. Flag pole height 72.18  + flag low 74  = 146.18 measured move target. So it seems to be worth targeting the

If you go to the maximum boundary of -28% then that gives you 74.16 and $GRAL high tight flag attempt put in a low at 74.  Good enough for <a href="/CubbieBears/">ryan 📈⛳️</a> and gubment work.

Flag pole height 72.18  + flag low 74  = 146.18 measured move target.

So it seems to be worth targeting the
JT (@tcmllc) 's Twitter Profile Photo

$ETH futures high of 4880.50 pullback levels. $BMNU is priced like a long dated call option. I sold short the Dec 19th 4 PUTS for .70 Bought the Dec 19th 15 CALLS for .20 Small test lot to see if it can get any traction with it. ETH futures are showing a Sequential 13

$ETH futures high of 4880.50 pullback levels. 

$BMNU is priced like a long dated call option. 

I sold short the Dec 19th 4 PUTS for .70
Bought the Dec 19th 15 CALLS for .20

Small test lot to see if it can get any traction with it. 

ETH futures are showing a Sequential 13
TML Trader (@tmltrader) 's Twitter Profile Photo

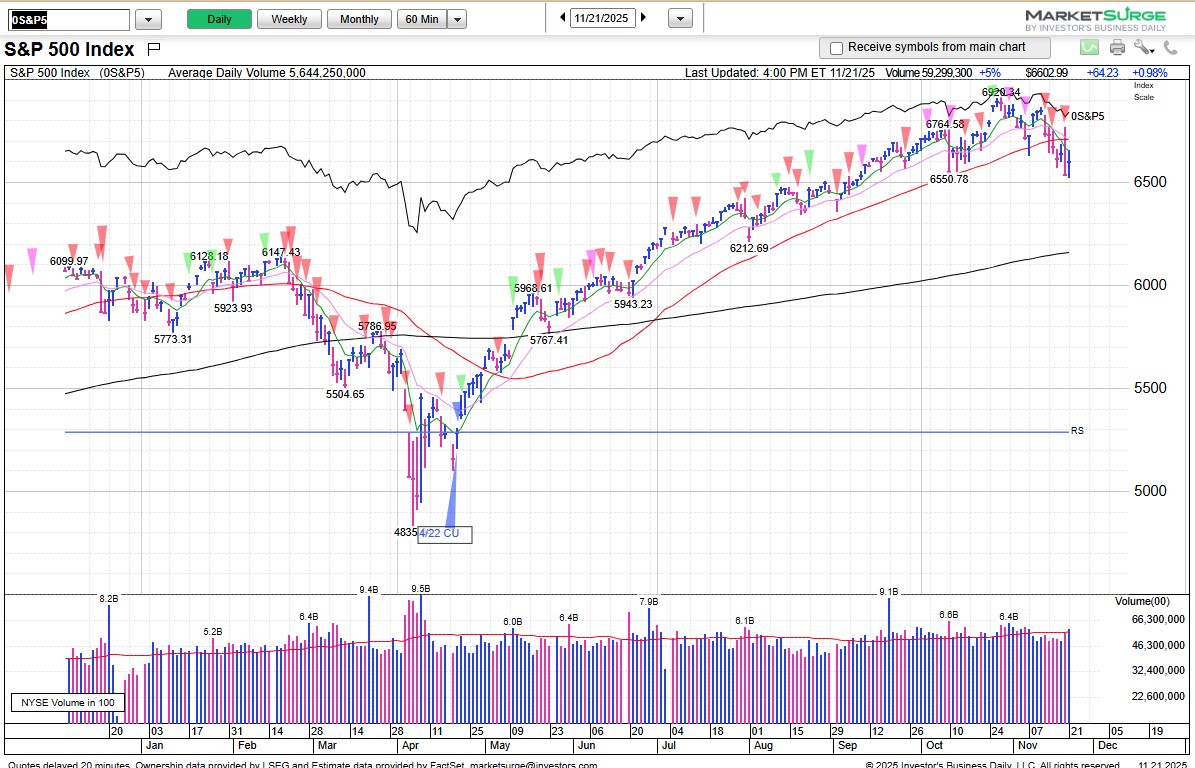
Weekend Review, 11/23: 0% to 20% Exposure Nasdaq and S&P 500 are back below the 50-day line, after Thursday's swoon similar to Oct. 10. Depths of indexes / ETFs from recent highs show mild pullback for the S&P 500 but growth stock ETFs took big hits: Nasdaq -8.83% S&P 500

Weekend Review, 11/23: 0% to 20% Exposure

Nasdaq and S&amp;P 500 are back below the 50-day line, after Thursday's swoon similar to Oct. 10.

Depths of indexes / ETFs from recent highs show mild pullback for the S&amp;P 500 but growth stock ETFs took big hits:

Nasdaq -8.83%
S&amp;P 500
JT (@tcmllc) 's Twitter Profile Photo

Trading in the Zone came up yesterday morning, so it made for a great moment to review some notes on it. Zach Lucido made a great 11 page summary back in 2014 and these are just a few of the quotes contained therein. "When you learn the trading skill of risk acceptance, the market

JT (@tcmllc) 's Twitter Profile Photo

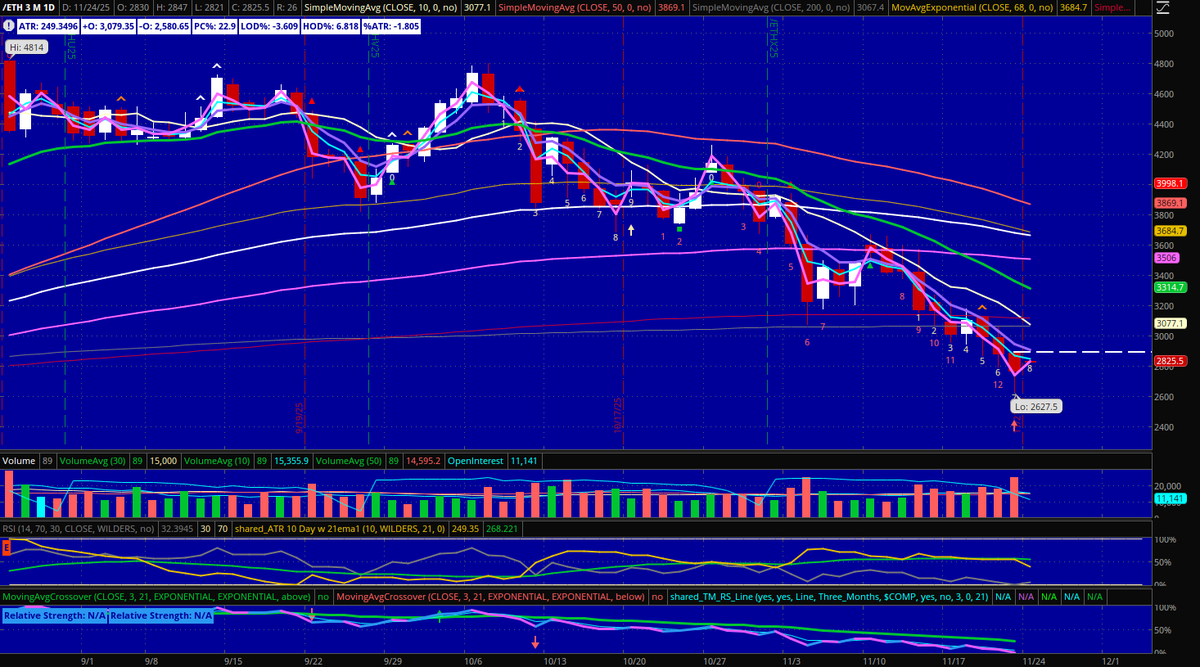
Long way to go from a Sunday globex open to a cash close on Monday, but $ETH has gapped up inside Friday's Sequential 13 bar. The pivot on that 13 is Friday's HOD 2893 and the stop would be Friday's LOD 2627.50. That would be in line with the current ATR on the daily.

Long way to go from a Sunday globex open to a cash close on Monday, but $ETH has gapped up inside Friday's Sequential 13 bar. 

The pivot on that 13 is Friday's HOD 2893 and the stop would be Friday's LOD 2627.50.  That would be in line with the current ATR on the daily.