Independent Voices ๐Ÿ‡บ๐Ÿ‡ฆ๐Ÿด๓ ง๓ ข๓ ณ๓ ฃ๓ ด๓ ฟ(@Celebs4indy) 's Twitter Profile Photo

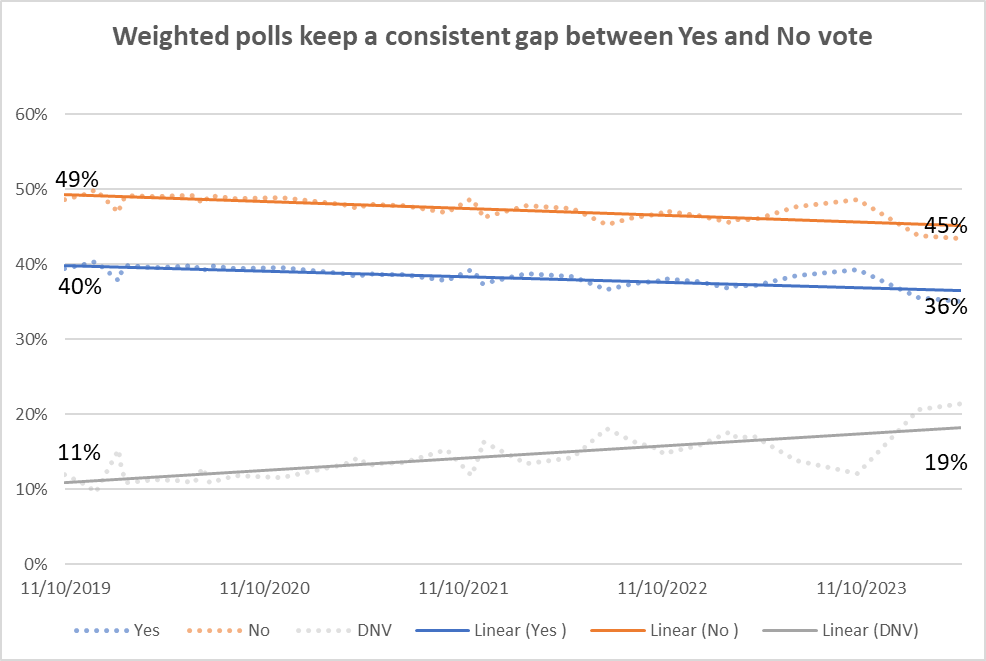
Weighted samples boost the No vote % by keeping an artificial gap of 8 or 9 points. In reality the gap is now only 2 or 3 points. Many pollsters also suppress the % of new voters - likely around 29% of the electorate now.

Weighted samples boost the No vote % by keeping an artificial gap of 8 or 9 points. In reality the gap is now only 2 or 3 points. Many pollsters also suppress the % of new voters - likely around 29% of the electorate now.
#Indyref2
account_circle
Independent Voices ๐Ÿ‡บ๐Ÿ‡ฆ๐Ÿด๓ ง๓ ข๓ ณ๓ ฃ๓ ด๓ ฟ(@Celebs4indy) 's Twitter Profile Photo

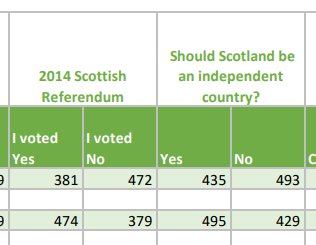
You can see what the Panelbase weighting does to the voting intention clearly in the polling tables.
The top line is weighted; the second line is unweighted.
This is not unusual, but the effects of this bizarre weighting are becoming more extreme.

You can see what the Panelbase weighting does to the #Indyref2 voting intention clearly in the polling tables.
The top line is weighted; the second line is unweighted.
This is not unusual, but the effects of this bizarre weighting are becoming more extreme.
account_circle
Independent Voices ๐Ÿ‡บ๐Ÿ‡ฆ๐Ÿด๓ ง๓ ข๓ ณ๓ ฃ๓ ด๓ ฟ(@Celebs4indy) 's Twitter Profile Photo

If you look at the unweighted samples over time, the different trends among 2014 Yes and No voters are pretty clear. The % who voted No has dropped more steeply due to the older demographics of this cohort.

If you look at the unweighted samples over time, the different trends among 2014 Yes and No voters are pretty clear. The % who voted No has dropped more steeply due to the older demographics of this cohort.
#Indyref2
account_circle
New.Wales(@aNewWales) 's Twitter Profile Photo

Yes ๐Ÿด๓ ง๓ ข๓ ณ๓ ฃ๓ ด๓ ฟ is back in the lead for the first time since November, in R&W polling.

account_circle
Independent Voices ๐Ÿ‡บ๐Ÿ‡ฆ๐Ÿด๓ ง๓ ข๓ ณ๓ ฃ๓ ด๓ ฟ(@Celebs4indy) 's Twitter Profile Photo

Another interesting set of data tables in the latest Panelbase/ Norstat poll. The unweighted figures show a whopping 7-pt Yes lead gets turned into a 7-pt No lead through weighting & turnout adjustment. A reasonable reweighting of the original figures would show a tie.

Another interesting set of data tables in the latest Panelbase/ Norstat #Indyref2 poll. The unweighted figures show  a whopping 7-pt Yes lead gets turned into a 7-pt No lead through weighting & turnout adjustment. A reasonable reweighting of the original figures would show a tie.
account_circle
๐Ÿด๓ ง๓ ข๓ ณ๓ ฃ๓ ด๓ ฟ Indy Cat ๐Ÿด๓ ง๓ ข๓ ณ๓ ฃ๓ ด๓ ฟ(@Mac_Gadget) 's Twitter Profile Photo

Scottish Labour Promise, promise but you do the opposite in real life ๐Ÿ˜ก
Taking money from the NHS, ยฃ10billion for ยฃ2billion worth of hospital ๐Ÿ˜
RED TOTIES ๐Ÿด๓ ง๓ ข๓ ณ๓ ฃ๓ ด๓ ฟ

@ScottishLabour Promise, promise but you do the opposite in real life ๐Ÿ˜ก
Taking money from the NHS, ยฃ10billion for ยฃ2billion worth of hospital ๐Ÿ˜
RED TOTIES #ScottishIndependenceASAP #IndyRef2 ๐Ÿด๓ ง๓ ข๓ ณ๓ ฃ๓ ด๓ ฟ
account_circle
Nod64(@Nod641) 's Twitter Profile Photo

Just a reminder that Labour also pissed away ยฃ2.5 million trying to stop women in Glasgow from getting equal pay. They also voted with the Tories to stop children from getting free school meals!


account_circle
Independent Voices ๐Ÿ‡บ๐Ÿ‡ฆ๐Ÿด๓ ง๓ ข๓ ณ๓ ฃ๓ ด๓ ฟ(@Celebs4indy) 's Twitter Profile Photo

After 2014 Yes voters, those who did not vote are the most likely to back (By 60:40 excluding D/K)
But why would a pollster have a declining % of new voters in a weighted poll?
Are yougov manipulating the sample to suit the narrative?

After 2014 Yes voters, those who did not vote are the most likely to back #Yes (By 60:40 excluding D/K)
But why would a pollster have a declining % of new voters in a weighted poll?
Are yougov manipulating the sample to suit the narrative?
#Indyref2
account_circle