Larry Marshall(@DrLarryMarshall) 's Twitter Profile Photo

As the national science agency, CSIRO is all about sharing the vital data needed to solve the greatest challenges. From this month, we'll be tweeting our CO2 observations so you can follow along at
csiro.au/greenhousegases

As the national science agency, @CSIRO is all about sharing the vital data needed to solve the greatest challenges. From this month, we'll be tweeting our CO2 observations so you can follow along at #CapeGrimCO2Update 
csiro.au/greenhousegases
account_circle
CSIRO(@CSIRO) 's Twitter Profile Photo

Monthly averaged baseline CO2 levels measured at Kennaook/Cape Grim, Tasmania:

May 2023: 415.71 ppm
May 2022: 413.76 ppm
May 2013: 392.46 ppm
May 2003: 372.53 ppm
May 1983: 339.53 ppm

Access the data: csiro.au/greenhousegases

Monthly averaged baseline CO2 levels measured at Kennaook/Cape Grim, Tasmania:

May 2023: 415.71 ppm
May 2022: 413.76 ppm
May 2013: 392.46 ppm
May 2003: 372.53 ppm
May 1983: 339.53 ppm

Access the data: csiro.au/greenhousegases

#KennaookCapeGrimCO2update #CapeGrimCO2update
account_circle
CSIRO(@CSIRO) 's Twitter Profile Photo


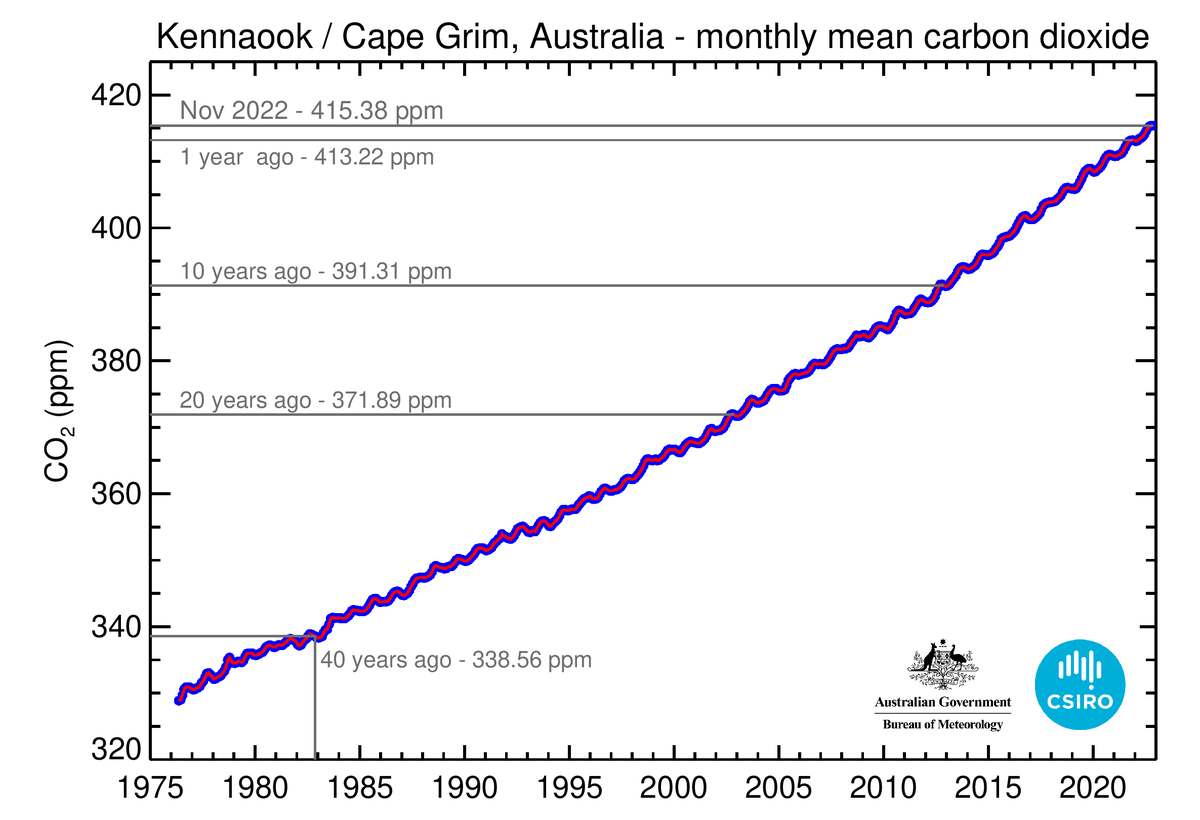
Monthly averaged baseline CO2 levels measured at Kennaook/Cape Grim, Tasmania

Nov 2022 415.38 ppm
Nov 2021 413.22 ppm
Nov 2012 391.31 ppm
Nov 2002 371.89 ppm
Nov 1982 338.56 ppm

Access the data: csiro.au/greenhousegases
#CapeGrimCO2update
#KennaookCapeGrimCO2update

Monthly averaged baseline CO2 levels measured at Kennaook/Cape Grim, Tasmania

Nov 2022   415.38 ppm
Nov 2021   413.22 ppm
Nov 2012   391.31 ppm
Nov 2002   371.89 ppm
Nov 1982   338.56 ppm

Access the data: csiro.au/greenhousegases
account_circle
Nick Pagett(@NickPagett7) 's Twitter Profile Photo

Why is CO2 trending? CSIRO we receive many questions each month about climate change and greenhouse gases. Read this blog on how we collect the data blog.csiro.au/co2-data-twitt…

account_circle