Superdot – visualizing complexity (@superdot_studio) 's Twitter Profile
Superdot – visualizing complexity

@superdot_studio

We are a passionate information design studio based in Basel. Dedicated to innovation since 2011. #superdot #visualizingcomplexity #dataviz #informationdesign

ID: 475817435

linkhttps://linktr.ee/superdot calendar_today27-01-2012 13:30:23

764 Tweet

984 Followers

972 Following

Superdot – visualizing complexity (@superdot_studio) 's Twitter Profile Photo

Happy Holidays! Thank you everyone for your support! Enjoy our data-driven Xmas card. #dataviz #modularinformationdesign #visualizingcomplexity #xmascard

Superdot – visualizing complexity (@superdot_studio) 's Twitter Profile Photo

#dieseskleinebuch has just arrived! Thank you Barbara Avila Vissirini Barbara Avila Vissirini for the first grammar guide combining German and visual grammar! 🤩 #visualizingcomplexity #visualgrammar #dataliteracy

#dieseskleinebuch has just arrived! Thank you Barbara Avila Vissirini <a href="/vilaviss/">Barbara Avila Vissirini</a> for the first grammar guide combining German and visual grammar! 🤩

#visualizingcomplexity #visualgrammar #dataliteracy
JasonForrest (@jasonforrestftw) 's Twitter Profile Photo

SO excited to open up a new role on the Data Visualization Lab team McKinsey & Company!!! We are looking for a full-stack dataviz developer to join us on some truly exciting projects this year. So if you have D3.js expertise, please apply here! mckinsey.com/careers/search…

SO excited to open up a new role on the Data Visualization Lab team <a href="/McKinsey/">McKinsey & Company</a>!!! We are looking for a full-stack dataviz developer to join us on some truly exciting projects this year.  So if you have D3.js expertise, please apply here! mckinsey.com/careers/search…
On Data And Design (@ondataanddesign) 's Twitter Profile Photo

In our next event on 03/09/2023, we explore whether visualizing knowledge is key to faster understanding. With Barbara Avila Vissirini Valentina D'Efilippo Dario Rodighiero @DarjanHil is hosting #OnDataAndDesign Please RSVP for the event ▶︎ eventbrite.ch/e/visualizing-… #dataviz #onlineevents

On Data And Design (@ondataanddesign) 's Twitter Profile Photo

▶︎ Valentina D'Efilippo talks about her latest projects and her experiences with illustrating history and human development through #datavisualization and #infographic #storytelling RSVP for the event, hosted by @darjanHil, with Barbara Avila Vissirini Dario Rodighiero ▶︎ linktr.ee/OnDataAndDesign

▶︎ <a href="/defilippovale/">Valentina D'Efilippo</a> talks about her latest projects and her experiences with illustrating history and human development through #datavisualization and #infographic #storytelling
RSVP for the event, hosted by @darjanHil, with <a href="/vilaviss/">Barbara Avila Vissirini</a> <a href="/dariorodighiero/">Dario Rodighiero</a> ▶︎ linktr.ee/OnDataAndDesign
Unlocking the Power of Data Initiative (@updinitiative) 's Twitter Profile Photo

Hey, we are at Superdot – visualizing complexity together with PARIS21 to discuss how to visualise data for good. We believe that communication 📞📡 and visualization 👀 is the key to making a difference and contributing to a better understanding of #data and #statistics by everyone.

Hey, we are at <a href="/superdot_studio/">Superdot – visualizing complexity</a> together with <a href="/ContactPARIS21/">PARIS21</a> to discuss how to visualise data for good. We believe that communication 📞📡 and visualization 👀 is the key to making a difference and contributing to a better understanding of #data and #statistics by everyone.
Superdot – visualizing complexity (@superdot_studio) 's Twitter Profile Photo

How many eggs were in your Easter basket?🐣 Since 2016, Superdot has been visualizing an #annualreport on the Swiss egg market for BLW - OFAG - UFAG. Insights to discover: For 2022, we've updated the #dashboard, the #isometric #poster and #socialmedia posts. 🐥blw.admin.ch/blw/de/home/ma…🐥

Superdot – visualizing complexity (@superdot_studio) 's Twitter Profile Photo

A little #retrospectie of 2017 👉 superdot.studio/project/visual… It doesn't always take #artificialintelligence to solve complex problems. Superdot developed a visual #chatbot that lets you add intriguing #ecommerce content to a shopping cart to personally evaluate it later. Swiss Post

A little #retrospectie of 2017
👉 superdot.studio/project/visual…
It doesn't always take #artificialintelligence to solve complex problems. Superdot developed a visual #chatbot that lets you add intriguing #ecommerce content to a shopping cart to personally evaluate it later.
<a href="/swisspost/">Swiss Post</a>
Superdot – visualizing complexity (@superdot_studio) 's Twitter Profile Photo

Our "SDG Experience" has been shown at the VIENNA DESIGN WEEK A huge shoutout to our partner Thomas Schulz from the Bundesamt für Statistik BFS for joining and supporting us. Kudos to the Schweizer Botschaft in Vienna. It was a resounding success! 🙌 Stay tuned for the web version! #SDGs UNStats

Our "SDG Experience" has been shown at the <a href="/VIENNADESIGN/">VIENNA DESIGN WEEK</a>  A huge shoutout to our partner Thomas Schulz from the <a href="/StatSchweiz/">Bundesamt für Statistik BFS</a>  for joining and supporting us. Kudos to the Schweizer Botschaft in Vienna. It was a resounding success! 🙌 Stay tuned for the web version! #SDGs <a href="/UNStats/">UNStats</a>
Bloomberg Graphics (@bbgvisualdata) 's Twitter Profile Photo

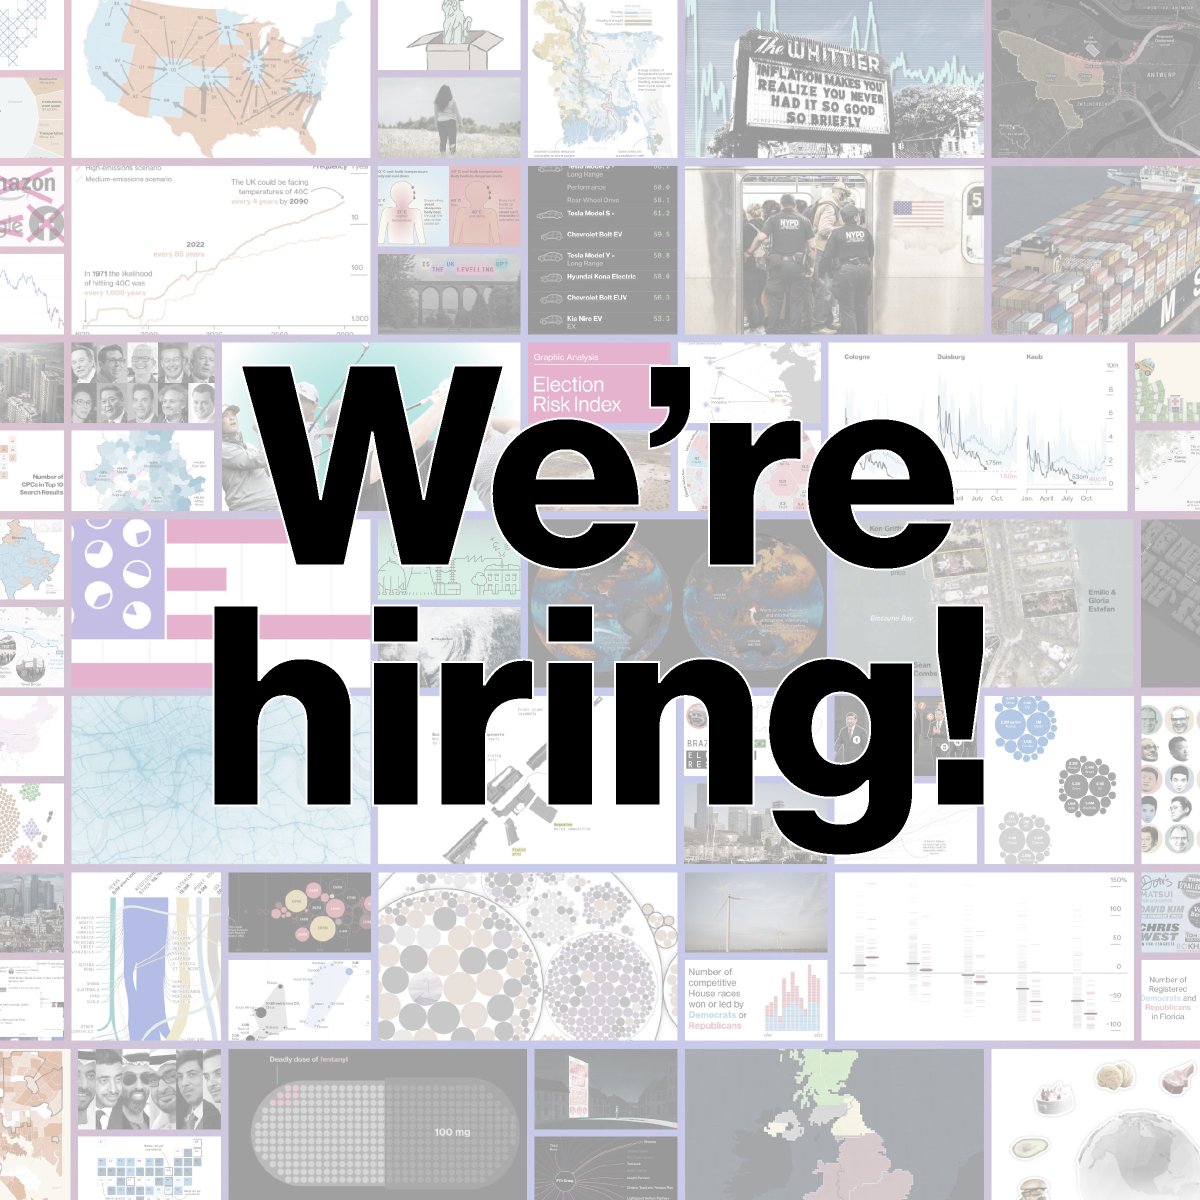
Bloomberg is expanding its data journalism and visualization teams globally by hiring approximately 40 new data journalists, data visualization reporters, editors and engineers. a thread 🧵…

Bloomberg is expanding its data journalism and visualization teams globally by hiring approximately 40 new data journalists, data visualization reporters, editors and engineers.

a thread 🧵…
Superdot – visualizing complexity (@superdot_studio) 's Twitter Profile Photo

🚀 Launch Announcement 🚀 Our data visualization course with Domestika is now live! Learn to transform raw data into impactful and beautiful visuals. 👉 Enroll here: bit.ly/superdot_studi… #DataViz #LearnDataViz #VisualStorytelling

Superdot – visualizing complexity (@superdot_studio) 's Twitter Profile Photo

Join @niclac and Darjan Hil's Domestika course Learn how to effectively and attractively visualize complex information. Gain insights into our methods and benefit from more than ten years of experience in the industry. 👉 bit.ly/superdot_studi…

Join @niclac and Darjan Hil's <a href="/Domestika/">Domestika</a> course Learn how to effectively and attractively visualize complex information. Gain insights into our methods and benefit from more than ten years of experience in the industry.
👉 bit.ly/superdot_studi…
Superdot – visualizing complexity (@superdot_studio) 's Twitter Profile Photo

In 2010 Hans Rosling proved that #statistics aren't only informative, but also entertaining. 12 years later, we updated this idea, adding #climateData as a third axis. The 3D #dataviz was commissioned to contribute to this revival project by Unlocking the Power of Data Initiative superdot.studio/project/animat…