Kimly
@scottkimly
Tableau Visionary & Ambassador | 18x #VOTD | 3x Runner-up WIA DataViz | 2x Vizzies Winner | #Ironviz Finalist '22 | @DiversityinData | #MomsWhoViz | #VeryAsian
ID: 1022145275891044352
http://shewillviz.com 25-07-2018 15:43:19
3,3K Tweet
1,1K Followers
1,1K Following


This #VizOfTheDay by Daisy Jones uses a Sankey chord diagram to visualize the flavors used by the final three contestants in the ultimate baking battle. tabsoft.co/4iCCrZU


The Flerlage twins are taking the main stage at #TC25! 🎤 Grab your seat at this must-see super session at Tableau Conference: How to Do Cool Stuff in Tableau with Ken Flerlage and Kevin Flerlage. Don't miss out: tabsoft.co/4kKvLe1


Thank you Tableau Public for the feature. I hope this will become a valuable resource for my fellow user group leaders.

Who else is getting excited for Tableau conference? Dinushki De Livera and I will be back and sharing the stage to host the Tableau Tip Battle. This year is a Luau theme and we have an incredible line-up of tipsters. Introducing the first 4... Tableau Visionaries, Felicia Styer,


Who else will be taking to the stage you?? The final four tipsters are... Tableau Visionary Hall of Famers Jeffrey Shaffer, Jonathan Drummey, Lorna Brown, and Sarah Bartlett I can't wait to see the amazing tips!!! #TC25 #datafam


I've published a new viz, looking at the diagnosis journey for autistic adults. Ken Flerlage 's curved timeline guide was a huge help in bringing my idea to life, but boy was there a lot of extra math to tip it on an angle! public.tableau.com/app/profile/he…

This #VizOfTheDay created during the 2025 #IronViz competition by finalist Kathryn McCrindle explores data from wildlife strikes. Kathryn uses map layers and features line and bar charts, maps and more. tabsoft.co/3GkCvzF


Solution Guide | #Tableau | #WOW2025 | Week 20 | Let's practice using the multi-fact relationship model! blog: donnacoles.home.blog/2025/05/19/let… cc: Yoshitaka Arakawa (Yoshi) Lorna Brown Erica Hughes 📊Sean Miller 🎧 Kyle Yetter Yusuke Nakanishi #WOW2025


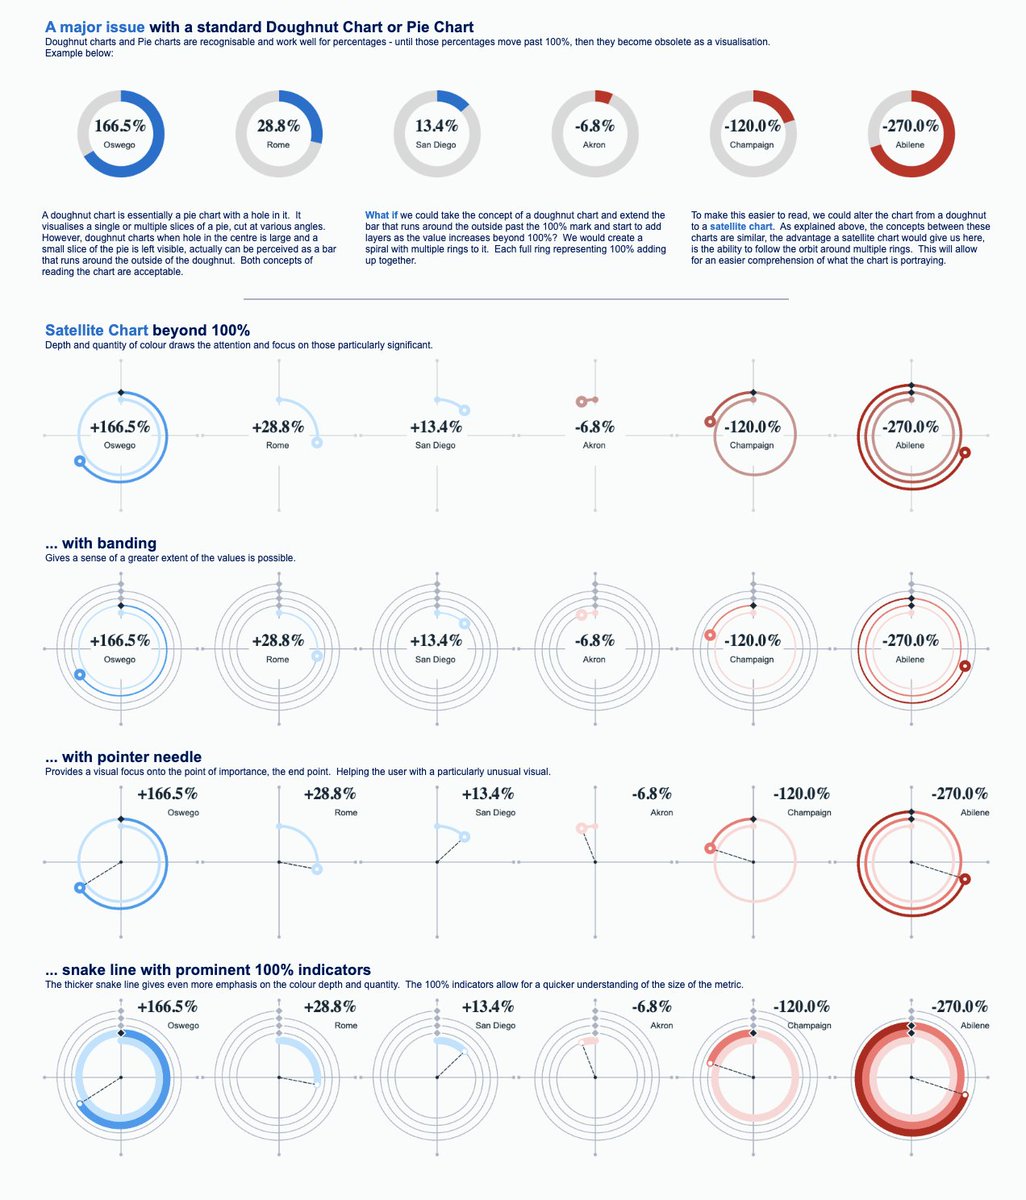
Try spiraling satellite charts with this #VizOfTheDay by Sam Parsons—an alternative to visualizing pie and doughnut charts when percentages exceed 100%. tabsoft.co/4drM1gX


