Ralph Spandl (spandl.bsky.social) (@ralph_spandl) 's Twitter Profile
Ralph Spandl (spandl.bsky.social)

@ralph_spandl

Head of Data Visualization at @Supermetrics
#measure · #dataviz · #d3js · #LookerStudio · #PowerBI

ID: 941422789101326336

linkhttps://supermetrics.com/supermetrics-charts calendar_today14-12-2017 21:40:58

1,1K Tweet

914 Takipçi

506 Takip Edilen

Ralph Spandl (spandl.bsky.social) (@ralph_spandl) 's Twitter Profile Photo

Join me on June 1 for an exciting Google Analytics 4 event! See a live presentation showing the power of utilizing GA4 data to analyze user journeys. Discover actionable insights like it wasn't possible with UA3. Secure your free seat now: s.r42.ca/GA4ward

Supermetrics (@supermetrics) 's Twitter Profile Photo

Marketers, analysts, and data enthusiasts! Mark your calendars for 'GA4ward - Before Sunset', an all-day Google Analytics 4 event happening on June 1. Watch out for Ralph Spandl (spandl.bsky.social) with a presentation on GA4 data and analyzing user journeys! More info & webinar link👇

MeasureMinds (@measure_minds) 's Twitter Profile Photo

👥Meet Ralph Spandl (spandl.bsky.social), Head of Data Visualization of Supermetrics, at GA4ward MKIII - Before Sunset! Ralph will share insights on "User journey visualizations with GA4 data" on 1st June, 13:15-13:55 (UK time). 🔽Register now for our FREE event!🔽 linkedin.com/events/ga4ward…

MeasureMinds (@measure_minds) 's Twitter Profile Photo

FREE #googleanalytics 4 conference this Thursday (1st of June) from 12:00 until 19:00 (UK time) featuring 8 expert speakers: Jim Sterne Ahmad Kanani @navahf Matteo Zambon Ralph Spandl (spandl.bsky.social) Phil Pearce Artem Korneev Stéphane Hamel Sign-up now for free! linkedin.com/events/ga4ward…

Ralph Spandl (spandl.bsky.social) (@ralph_spandl) 's Twitter Profile Photo

Two days left before GA4ward takes place. In my session, you'll learn how to use GA4 data to visualize user journeys, but there are 7 other sessions this day! You can get your free ticket now: linkedin.com/events/ga4ward…

Ralph Spandl (spandl.bsky.social) (@ralph_spandl) 's Twitter Profile Photo

The video of my presentation about creating user journey visualizations in Looker Studio is now available on YouTube. You can learn how to create a Sankey diagram with your GA4 data to see how your users navigate your site. youtube.com/watch?v=J-lTR6…

Ralph Spandl (spandl.bsky.social) (@ralph_spandl) 's Twitter Profile Photo

10 practical tips, explained on 5 simple dashboards. If you're new to #Lookerstudio this is a must-see webinar. Don't miss out — register today.

Datawrapper (@datawrapper) 's Twitter Profile Photo

New blog post! Our author Lisa Charlotte Muth shares tricks on how you can create a more useful color legend in your next #dataviz. Also included: A big, annotated collection of smart color keys. Read her article here: blog.datawrapper.de/color-keys-for…
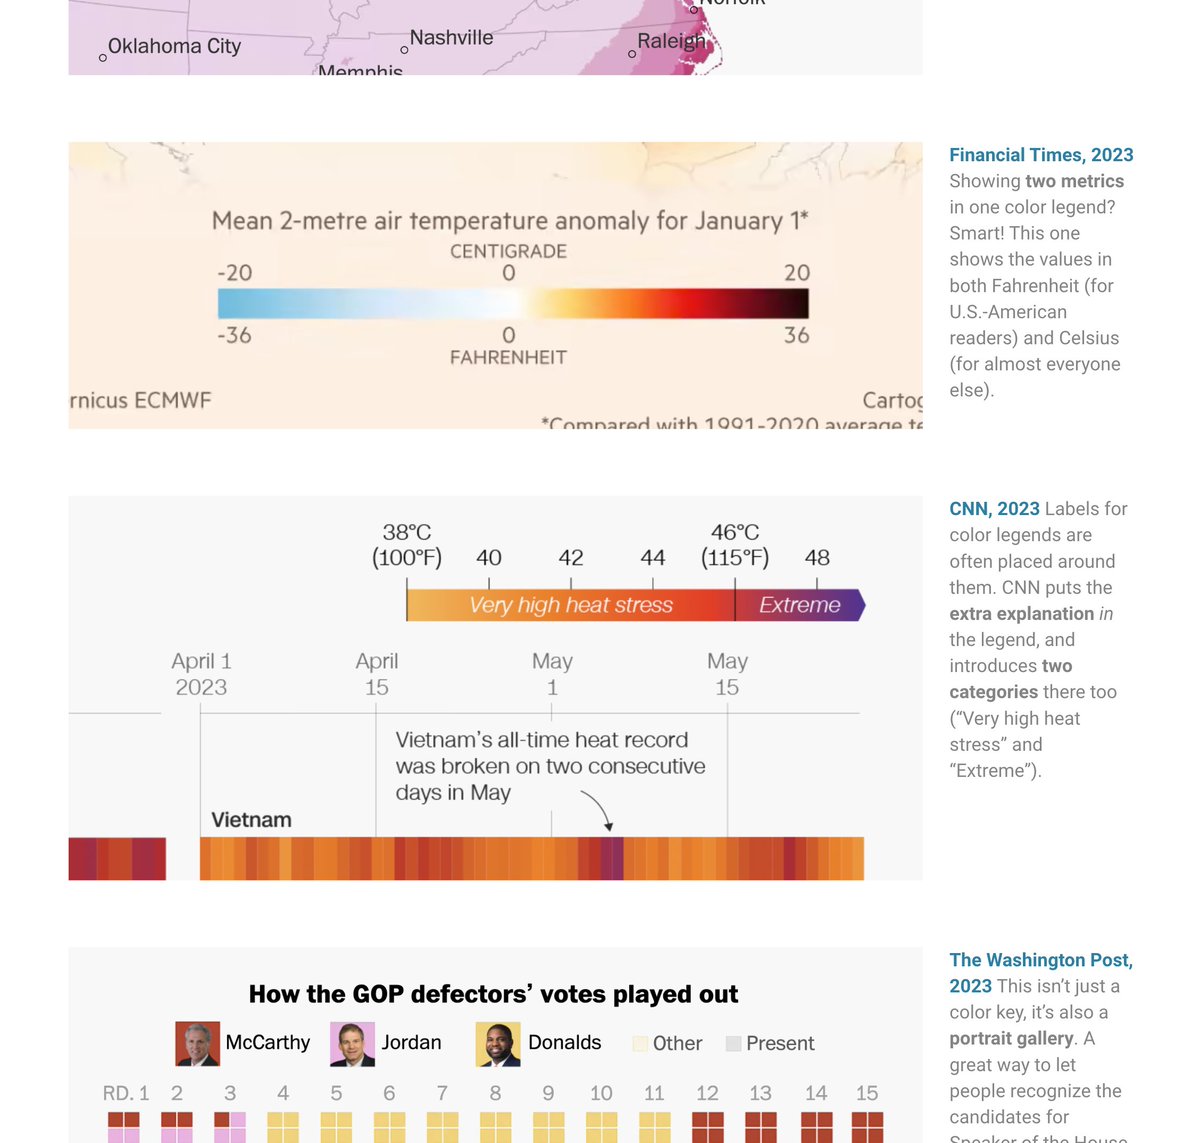
New blog post! Our author <a href="/lisacmuth/">Lisa Charlotte Muth</a> shares tricks on how you can create a more useful color legend in your next #dataviz. Also included: A big, annotated collection of smart color keys.

Read her article here: blog.datawrapper.de/color-keys-for…
Ralph Spandl (spandl.bsky.social) (@ralph_spandl) 's Twitter Profile Photo

Very happy with how the axes have come together for the custom time series visuals I'm creating for Looker Studio. Labels are vital, but fine-tuning them can be time-consuming. Exploring the different scenarios was a substantial effort, but the result is quite satisfying.

Very happy with how the axes have come together for the custom time series visuals I'm creating for Looker Studio.  

Labels are vital, but fine-tuning them can be time-consuming.   Exploring the different scenarios was a substantial effort, but the result is quite satisfying.
Ralph Spandl (spandl.bsky.social) (@ralph_spandl) 's Twitter Profile Photo

I’m also in the camp of “use pie charts, but use with care”. But nobody explains the why better than Nick Desbarats in his book “Practical Charts”. I’m sure there is copy lying around in the Supermetrics office. 😀
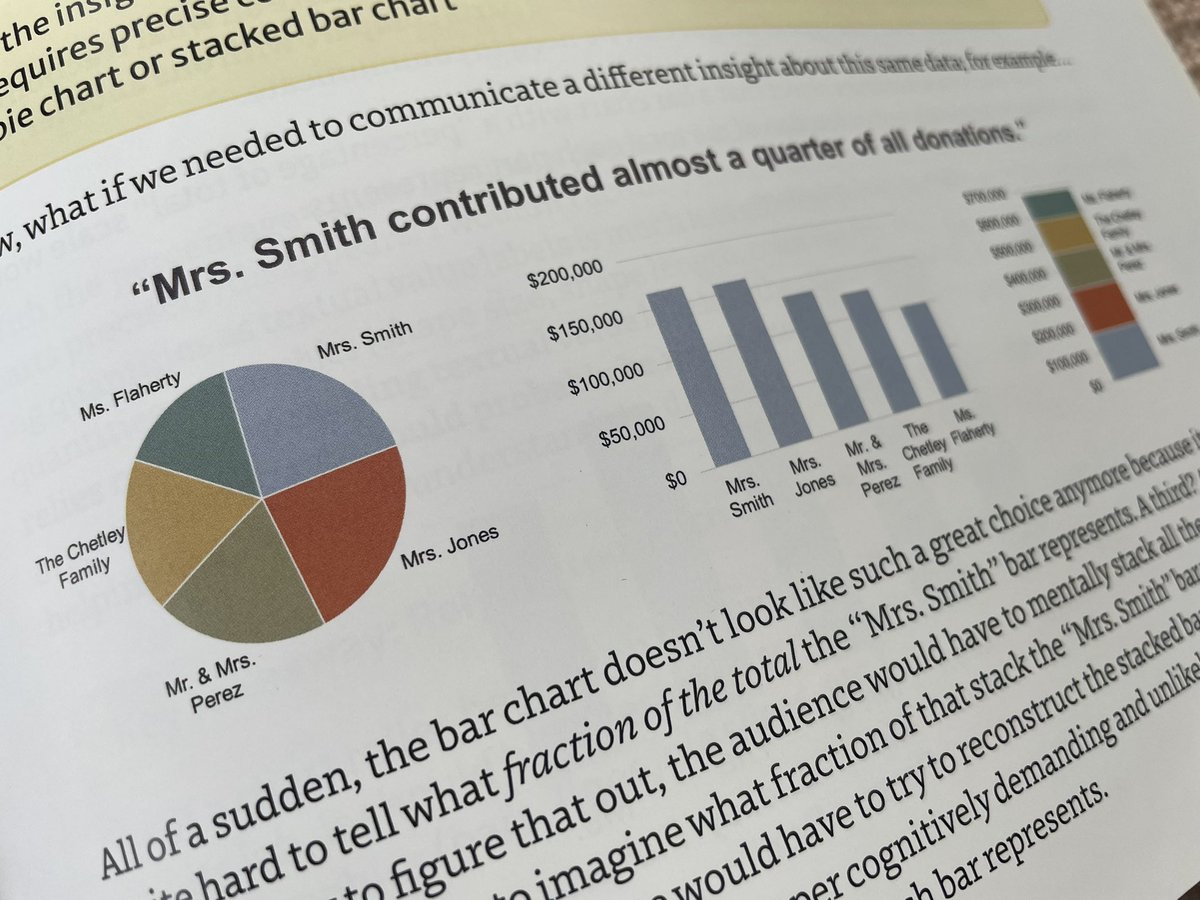
I’m also in the camp of “use pie charts, but use with care”.

But nobody explains the why better than <a href="/nickdesb/">Nick Desbarats</a> in his book “Practical Charts”.

I’m sure there is copy lying around in the <a href="/Supermetrics/">Supermetrics</a> office. 😀
Ralph Spandl (spandl.bsky.social) (@ralph_spandl) 's Twitter Profile Photo

Or, a report may consider to start with a big bang to be sure users are actually reading it. Tell them who the murder is on page 1, then explain how you found out.

Ralph Spandl (spandl.bsky.social) (@ralph_spandl) 's Twitter Profile Photo

Sports stats are trending. So, I thought it might be interesting to track the overall standings of the Tour de France in Looker Studio. Find the link and the short story of the report in this community post: community.supermetrics.com/data-visualiza… Who will be on top after 21 stages?

Sports stats are trending. 

So, I thought it might be interesting to track the overall standings of the Tour de France in Looker Studio.  

Find the link and the short story of the report in this community post:  
community.supermetrics.com/data-visualiza…

Who will be on top after 21 stages?
Ralph Spandl (spandl.bsky.social) (@ralph_spandl) 's Twitter Profile Photo

Sometimes, dashboards profit from simple insights. You may want to compare a metric value of a single dimension to an aggregated value of the complete dataset. We must use data blends and custom vizzes to do this in Looker Studio. Find out how: community.supermetrics.com/tips-and-trick…

Sometimes, dashboards profit from simple insights. You may want to compare a metric value of a single dimension to an aggregated value of the complete dataset.

We must use data blends and custom vizzes to do this in Looker Studio. 

Find out how: community.supermetrics.com/tips-and-trick…
Ralph Spandl (spandl.bsky.social) (@ralph_spandl) 's Twitter Profile Photo

Why is Supermetrics not on Bluesky? Half of Brazil joined last week. That's a great opportunity to create a new marketing community. ft.com/content/c15eef…