Prasann Prem (@prem_prasann) 's Twitter Profile
Prasann Prem

@prem_prasann

Founder @VizDiner | Tableau Visionary | Tableau Social Ambassador | Tableau Buddy | 4x VOTD

ID: 742439902697099264

linkhttps://www.vizdiner.com calendar_today13-06-2016 19:34:01

5,5K Tweet

2,2K Followers

945 Following

Prasann Prem (@prem_prasann) 's Twitter Profile Photo

Tableau Buddy Sandbox is excited to kick off its next expert session by Dennis Kao this Friday!✨ His session on "Geospatial Analysis using Tableau" will be essential for our mentees to take their map skills to new heights! Thanks, Dennis, for your time!

Tableau Buddy Sandbox is excited to kick off its next expert session by <a href="/professorkao/">Dennis Kao</a> this Friday!✨ 

His session on "Geospatial Analysis using Tableau" will be essential for our mentees to take their map skills to new heights!

Thanks, Dennis, for your time!
Prasann Prem (@prem_prasann) 's Twitter Profile Photo

Tableau Buddy Sandbox is excited to kick off its next expert session with Shreya Arya this coming Friday! Her session on "Designing backgrounds using Figma" will be essential for our mentees to take their design skills to new heights! Thanks, Shreya, for your time!

Tableau Buddy Sandbox is excited to kick off its next expert session with <a href="/datavizfairy/">Shreya Arya</a> this coming Friday!
 
Her session on "Designing backgrounds using Figma" will be essential for our mentees to take their design skills to new heights!

Thanks, Shreya, for your time!
Jennifer Dawes (@jreevers5) 's Twitter Profile Photo

New Data Viz: Happy early Mother's Day!!! To all the amazing women in our community whether you are a mom in the traditional sense or a mother figure, aunt or role model to the next generation, bravo! This was a fun parameter and custom shapes data art build. Check it out to see

Prasann Prem (@prem_prasann) 's Twitter Profile Photo

From Data Analysts to Data Designers 🎨 Thanks to Shreya Arya's session on Figma, we had to kinda pull on our sunglasses to look cooler 😎 It was a power-packed session at Sandbox, and we had a great time learning how to use groups, auto-layout, & many other functionalities✨

From Data Analysts to Data Designers 🎨  Thanks to <a href="/datavizfairy/">Shreya Arya</a>'s session on Figma, we had to kinda pull on our sunglasses to look cooler 😎

It was a power-packed session at Sandbox, and we had a great time learning how to use groups, auto-layout, &amp; many other functionalities✨
Arshi Saleh | @arshisaleh.bsky.social (@saleharshi) 's Twitter Profile Photo

Hello #datafam! My viz "APT: Voices for Human Dignity" has made it to the Top 10 Finalists for the Women in Analytics (WIA) Data viz Competition. I now need your help to make it to the Top 5. If you like my viz then please vote for it. Voting Link: dataconnectconf.com/data-viz-final…

Hello #datafam!  
My viz "APT: Voices for Human Dignity" has made it to the Top 10 Finalists for the <a href="/wia_community/">Women in Analytics (WIA)</a> Data viz Competition.  I now need your help to make it to the Top 5. 
If you like my viz then please vote for it.
Voting Link: dataconnectconf.com/data-viz-final…
Victory Omovrah (@vizwithvictory) 's Twitter Profile Photo

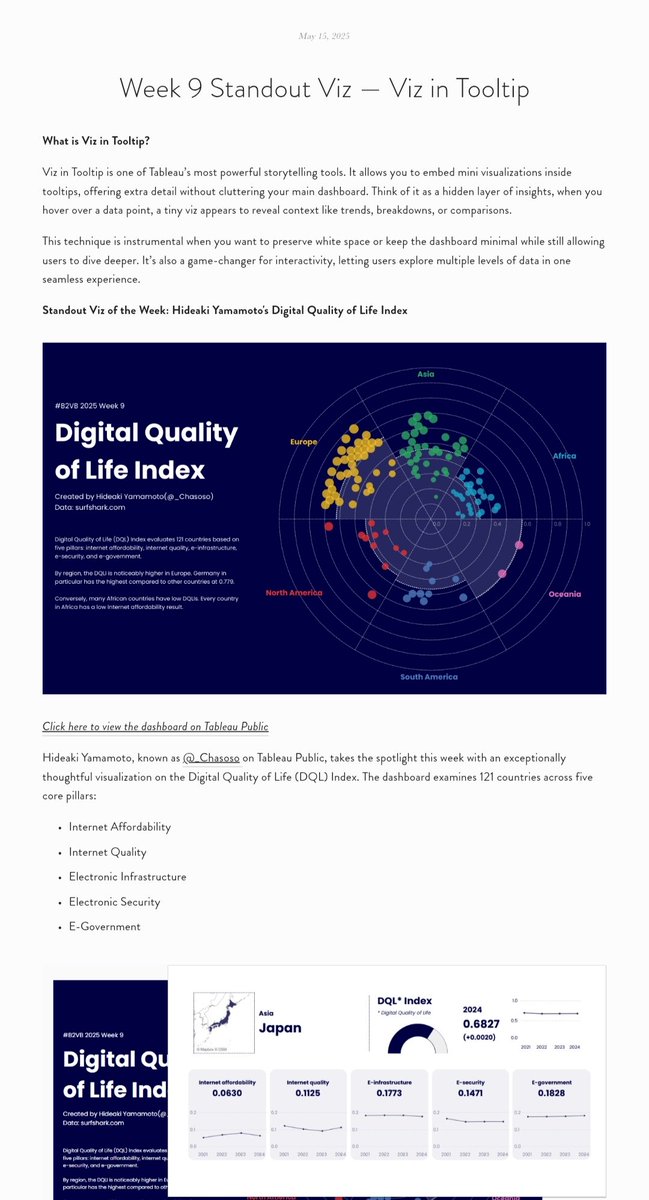
Just launched a new weekly blog series: Beyond Basic Blog! Every week, I spotlight a standout viz from the #B2VB challenge - breaking down why it works, the design choices, and cool features. 🔗 Read Week 9: thetableaustudentguide.com/back-2-viz-bas… #DataFam #Tableau #DataViz #VizInTooltip

Just launched a new weekly blog series: Beyond Basic Blog!

Every week, I spotlight a standout viz from the #B2VB challenge - breaking down why it works, the design choices, and cool features.

🔗 Read Week 9: thetableaustudentguide.com/back-2-viz-bas…
#DataFam #Tableau #DataViz #VizInTooltip
Tableau Public (@tableaupublic) 's Twitter Profile Photo

Try spiraling satellite charts with this #VizOfTheDay by Sam Parsons—an alternative to visualizing pie and doughnut charts when percentages exceed 100%. tabsoft.co/4drM1gX
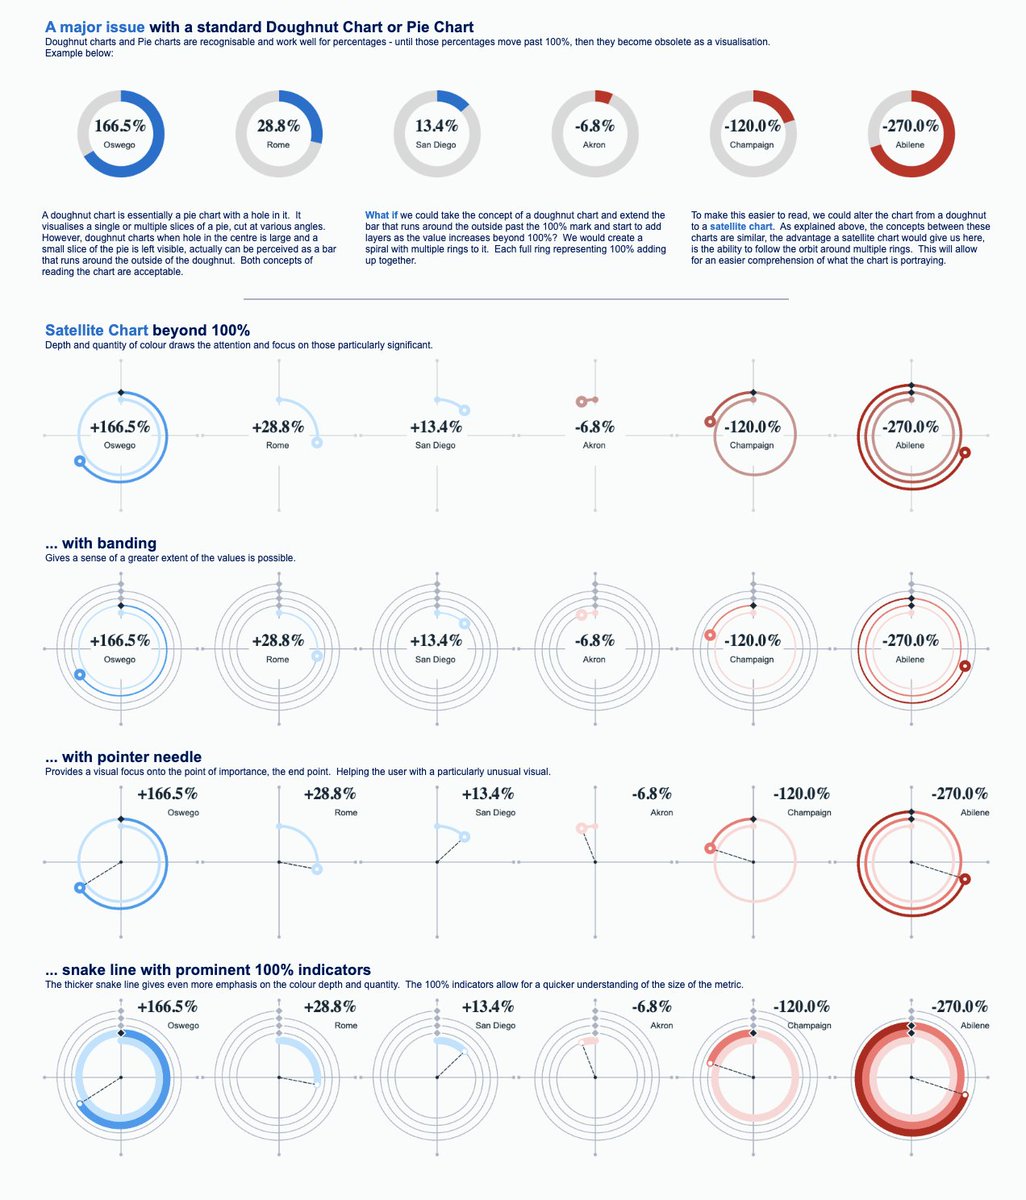
Try spiraling satellite charts with this #VizOfTheDay by <a href="/SParsonsDataViz/">Sam Parsons</a>—an alternative to visualizing pie and doughnut charts when percentages exceed 100%. tabsoft.co/4drM1gX
Tableau Public (@tableaupublic) 's Twitter Profile Photo

In celebration of Asian American and Pacific Islander (AAPI) Heritage Month, explore this Tableau Public collection of vizzes curated by Tableau Visionary Dennis Kao and Tableau Ambassador Elaine Yuan. tabsoft.co/3SbIXeV

Tore Levinsen (@torelev) 's Twitter Profile Photo

📝 Tableau 2024.2 introduced spell check in web authoring via your browser. For Desktop users, install Grammarly (free) to check calculations, captions, titles, etc. More info/video: torelevinsen.com/tinytableautip… #tinytableautip #spellcheck #desktop #lifesaver

📝 <a href="/tableau/">Tableau</a>  2024.2 introduced spell check in web authoring via your browser. 
For Desktop users, install <a href="/Grammarly/">Grammarly</a> (free) to check calculations, captions, titles, etc. 
More info/video: torelevinsen.com/tinytableautip…
#tinytableautip #spellcheck #desktop #lifesaver
Louis Yu (@datavizlouis) 's Twitter Profile Photo

Apart from "Let It Go", did you ever wondered how different the music in Disney musicals and movies are? Join us #datafam as Nicole Klassen shares her #IronViz piece, including a very unique Ternary Plot too! 📺 𝐘𝐨𝐮𝐓𝐮𝐛𝐞 youtu.be/Boug-5Uy6tg

Apart from "Let It Go", did you ever wondered how different the music in <a href="/Disney/">Disney</a> musicals and movies are? Join us #datafam as <a href="/NicoleKlassen12/">Nicole Klassen</a> shares her  #IronViz piece, including a very unique Ternary Plot too!

📺 𝐘𝐨𝐮𝐓𝐮𝐛𝐞
youtu.be/Boug-5Uy6tg
Kevin Wee 黃克文 (@kevinwee90) 's Twitter Profile Photo

🚨 NEW VIZ: Hi #datafam, I've always wanted a Tableau dashboard that helps me analyze the survey data from my presentations. So, I've made one for my #TC25 talk: rb.gy/cu59qu You may click any shape in the dot plot to read all responses from a selected attendee.

Prasann Prem (@prem_prasann) 's Twitter Profile Photo

Whether the hero was Agentforce - meeting the local Tableau team and users was full of conversations about the tool we love! ❤️ Had an amazing day at Agentforce Tour Dubai!

Whether the hero was Agentforce - meeting the local Tableau team and users was full of conversations about the tool we love! ❤️

Had an amazing day at Agentforce Tour Dubai!
Prasann Prem (@prem_prasann) 's Twitter Profile Photo

A dream that started this year finally met its first milestone - proud to share that Tableau Buddy Sandbox 1st cohort has graduated 🥳 All thanks to our Tableau community members who made this dream a reality Be it judges, mentors & our guest speakers - it's been a pleasure!

A dream that started this year finally met its first milestone - proud to share that Tableau Buddy Sandbox  1st cohort has graduated 🥳

All thanks to our <a href="/tableau/">Tableau</a> community members who made this dream a reality 

Be it judges, mentors &amp; our guest speakers - it's been a pleasure!
Tableau (@tableau) 's Twitter Profile Photo

Join Tableau's product team to see the latest updates in Tableau Prep, Custom Themes, and Tableau Semantics! Catch a demo of what's new, ask your questions, and share your feedback: tabsoft.co/43GOxLO

Join Tableau's product team to see the latest updates in Tableau Prep, Custom Themes, and Tableau Semantics!

Catch a demo of what's new, ask your questions, and share your feedback: tabsoft.co/43GOxLO
Tableau (@tableau) 's Twitter Profile Photo

Unlock peak performance for your dashboards in Tableau. Tableau Ambassador Igor Garlowski shows how fundamental data engineering concepts and effective communication can revolutionize your performance and team collaboration. Stream this session on YouTube:

Unlock peak performance for your dashboards in Tableau.

Tableau Ambassador Igor Garlowski shows how fundamental data engineering concepts and effective communication can revolutionize your performance and team collaboration.

Stream this session on YouTube:
Steve Adams (@visual__dj) 's Twitter Profile Photo

You're comparing this year’s sales to last year’s. You’ve coloured the bars blue and orange. You think you’ve shown the variance. But what you’ve actually done - is highlight the whole bar. docs.google.com/document/d/1wj… #Tableau #DataVisualisation #DashboardDesign #VizDJ #TableauTips

Tableau Public (@tableaupublic) 's Twitter Profile Photo

This #VizOfTheDay by Seoyeon Jun 📊 uses a radial chart to explore the careers of over 2 million actors from the IMDb dataset. Explore this #DataPlusMovies entry: tabsoft.co/4jBTI5i
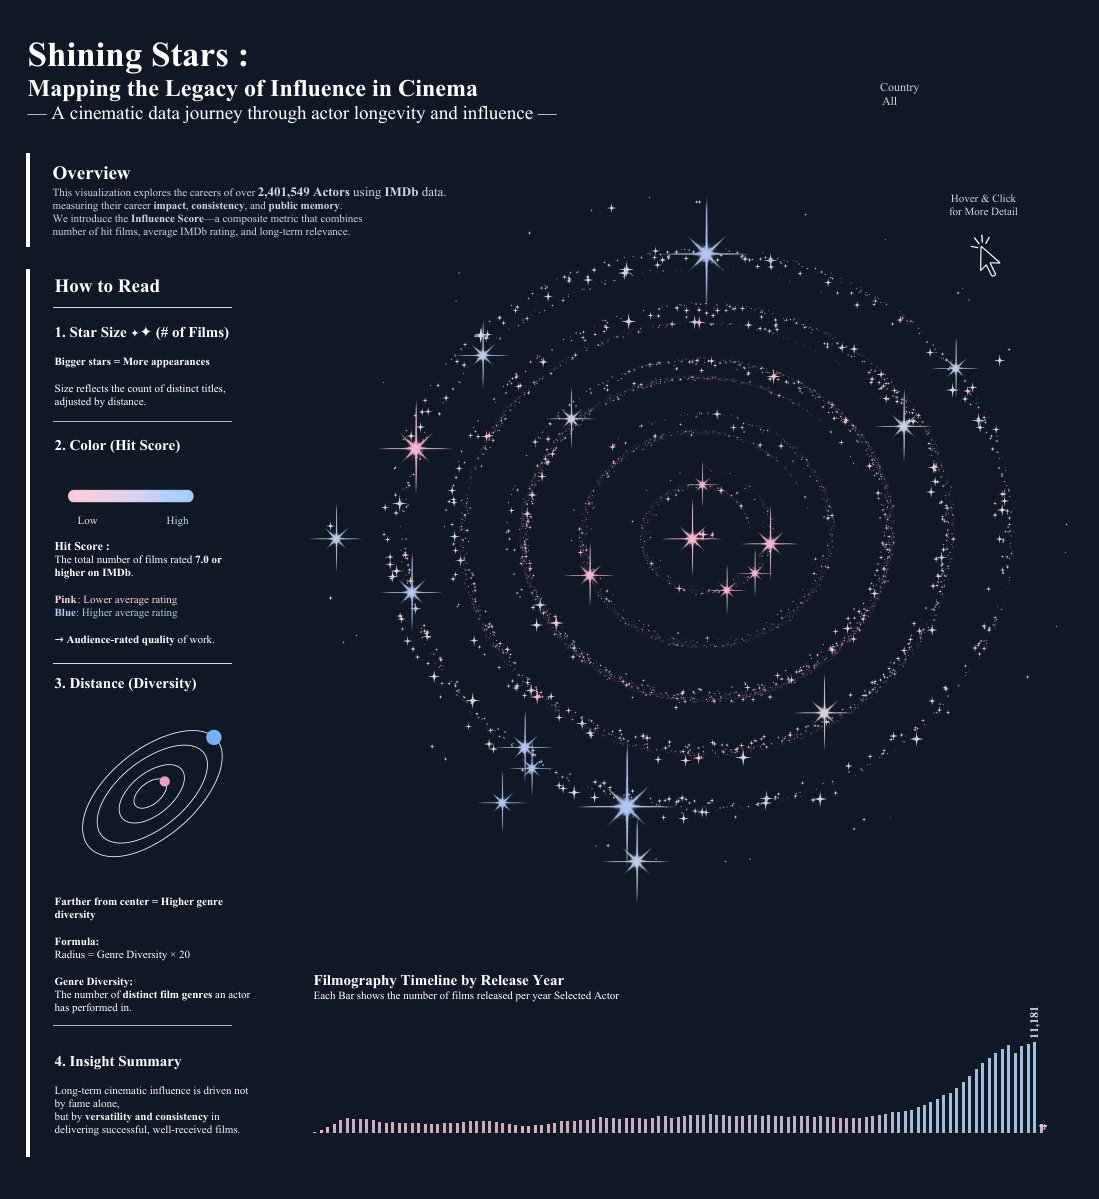
This #VizOfTheDay by <a href="/tableau_viz/">Seoyeon Jun 📊</a> uses a radial chart to explore the careers of over 2 million actors from the IMDb dataset. 

Explore this #DataPlusMovies entry: tabsoft.co/4jBTI5i
Tableau (@tableau) 's Twitter Profile Photo

The #DataFam is translating Tableau Conference inspiration into real-world impact! The #TC25 Encore is here! 🎉 Catch key insights, new features & tips with TC25 Encore User Groups. Join events, learn new skills & network! tabsoft.co/3ZqyUXn

The #DataFam is translating Tableau Conference inspiration into real-world impact! The #TC25 Encore is here! 🎉

Catch key insights, new features &amp; tips with TC25 Encore User Groups. Join events, learn new skills &amp; network! tabsoft.co/3ZqyUXn