Palette (@palette_dev) 's Twitter Profile
Palette

@palette_dev

Monitor interaction/pageload/react latency and JS profiles from end users. It's like chrome devtools, in production.

Get a Demo 👉 bit.ly/4jFrRld

ID: 1458859295634649089

linkhttps://palette.dev calendar_today11-11-2021 18:09:10

8 Tweet

2,2K Followers

1 Following

Amila Welihinda (@amilajack) 's Twitter Profile Photo

Notion integrated Palette to solve these challenges. Palette (Palette) collects production JavaScript profiles, traces, and metrics from end users. They configured Palette to profile 3% of all keypresses, sending 60B data points every two weeks.

Amila Welihinda (@amilajack) 's Twitter Profile Photo

Introducing Palette Palette (palette.dev) - the next generation of web performance monitoring. It features: - Production JavaScript profiling - First-class interaction performance metrics - Chrome Devtools-like perf debugging experience See how Notion used

Amila Welihinda (@amilajack) 's Twitter Profile Photo

"Best technical deep dive I have read in a while!" -- Principle Web Performance Eng @ Microsoft If you're building a large, JS heavy web app, you might find production JS profiling interesting, check it out. palette.dev/blog/improving…

Amila Welihinda (@amilajack) 's Twitter Profile Photo

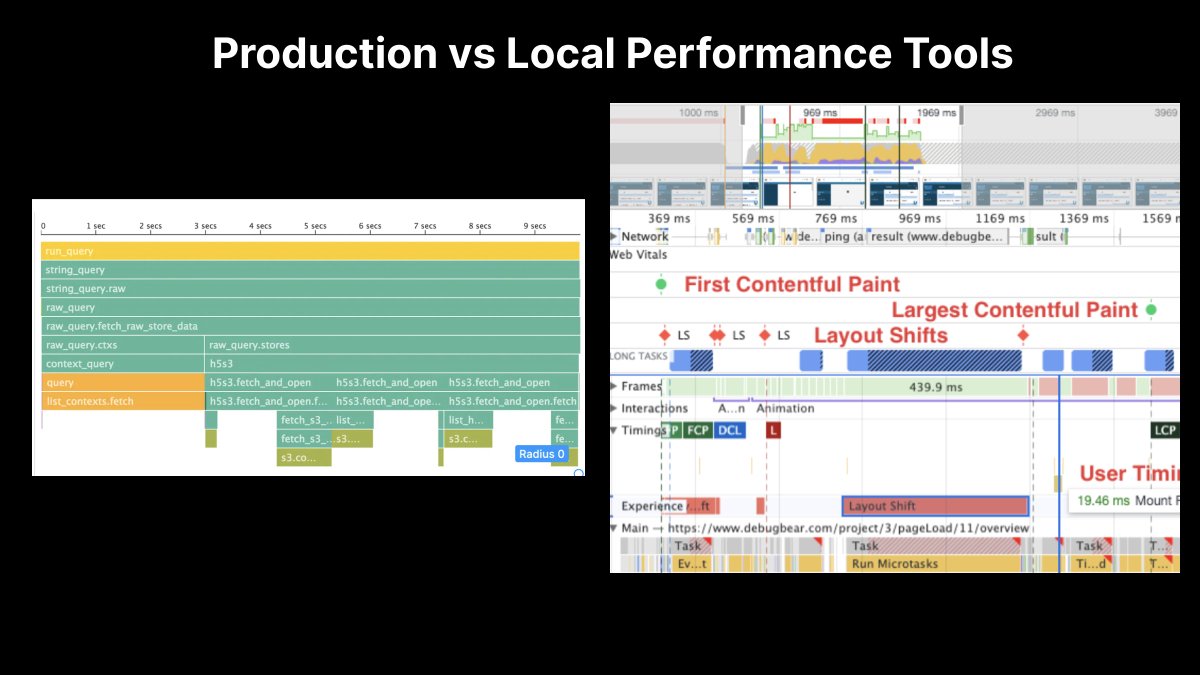
frontend production performance tools like datadog feel like toys next to local tools (ie. chrome devtools). they lack full context by fragmenting tracing, metrics, and profiling data across separate views/products, forcing devs to lean on chrome devtools to fix prod perf

frontend production performance tools like datadog feel like toys next to local tools (ie. chrome devtools).

they lack full context by fragmenting tracing, metrics, and profiling data across separate views/products, forcing devs to lean on chrome devtools to fix prod perf