Mike Paulenoff (@mptrader) 's Twitter Profile
Mike Paulenoff

@mptrader

35 Yrs on Wall Street, Macro & Behavioral Financial Market Strategist, Author, Columnist, Lawrenceville School, Georgetown Univ. SFS '79, Gtown Tennis '76-'79

ID: 40053049

linkhttp://www.mptrader.com calendar_today14-05-2009 18:25:01

2,2K Tweet

1,1K Followers

1,1K Following

Mike Paulenoff (@mptrader) 's Twitter Profile Photo

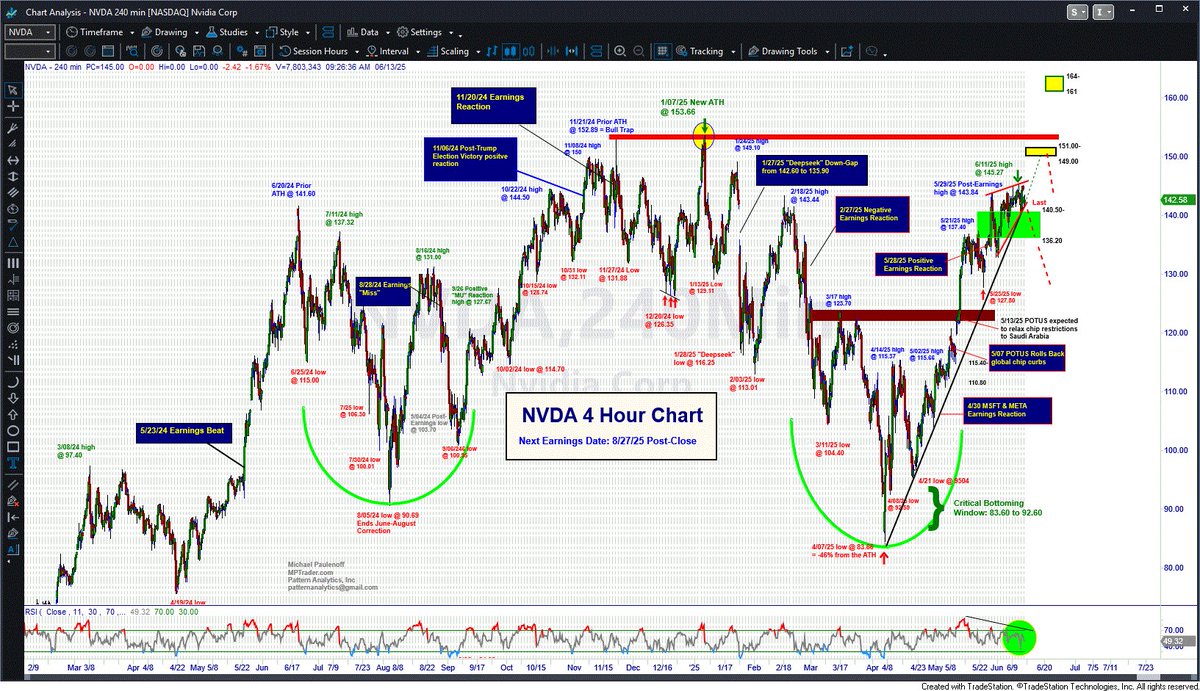
$NVDA, the poster child for the AI chip-producing technology sector, is down 1.6% in pre-market trading, which we notice remains ABOVE the dominant post-April up trendline, and as such, has endured zero damage from the overnight negative geopolitical news. Indeed, the big tech

$NVDA, the poster child for the AI chip-producing technology sector, is down 1.6% in pre-market trading, which we notice remains ABOVE the dominant post-April up trendline, and as such, has endured zero damage from the overnight negative geopolitical news. Indeed, the big tech
Mike Paulenoff (@mptrader) 's Twitter Profile Photo

After declining 4.1% from last Wed's high at 708.87 to Friday's low at 679.71, which my work argued was the initiation of a meaningful correction into the 665 or 640 target support windows after a 52% vertical advance from April to June 2025, $META announces a potentially

After declining 4.1% from last Wed's high at 708.87 to Friday's low at 679.71, which my work argued was the initiation of a meaningful correction into the 665 or 640 target support windows after a 52% vertical advance from April to June 2025, $META announces a potentially
Mike Paulenoff (@mptrader) 's Twitter Profile Photo

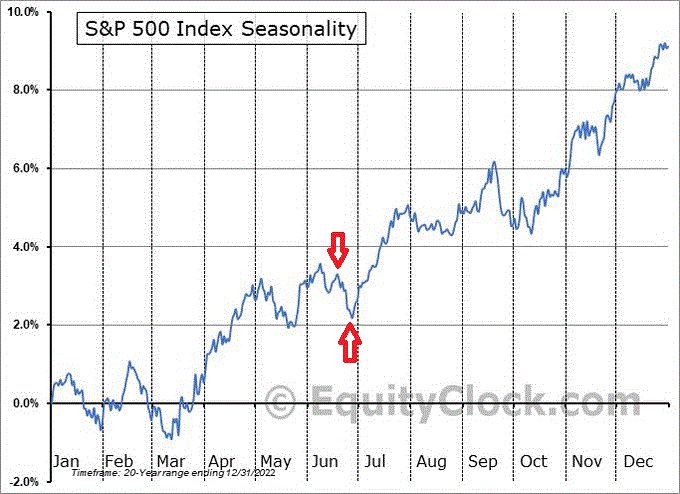
Based on the cash SPX seasonal propensities for the past 25 years, the next several trading days have been weak historically, which adds a bit of negativity to the near-term outlook.

Based on the cash SPX seasonal propensities for the past 25 years, the next several trading days have been weak historically, which adds a bit of negativity to the near-term outlook.
Mike Paulenoff (@mptrader) 's Twitter Profile Photo

Every person on the planet is now aware that early on Saturday night, the U.S. military attacked and severely damaged (destroyed?) Iran's nuclear sites and presumably their ability to produce nuclear materials needed to create a WMD. Now what? Will the Supreme Leader opt for

Mike Paulenoff (@mptrader) 's Twitter Profile Photo

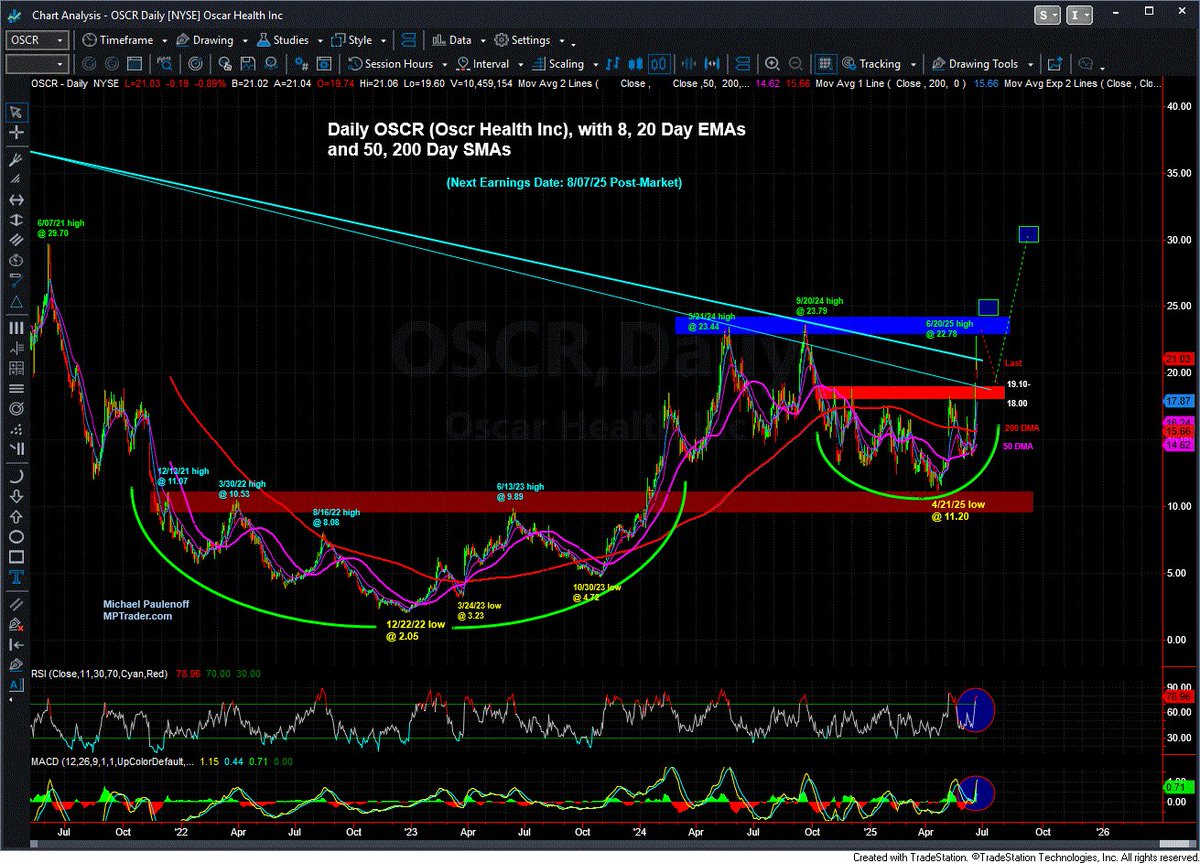
A name I continue to read about is the healthcare provider $OSCR, which is the latest darling in the healthcare space... Technically, it is difficult for me to argue against intermediate-term upside continuation, considering the stock is emerging from a 3 1/2 year Cup and Handle

A name I continue to read about is the healthcare provider $OSCR, which is the latest darling in the healthcare space...

Technically, it is difficult for me to argue against intermediate-term upside continuation, considering the stock is emerging from a 3 1/2 year Cup and Handle
Mike Paulenoff (@mptrader) 's Twitter Profile Photo

Spot Gold is down 2% in the aftermath of the Israel-Iran conflict...What now? From the Big Picture pattern perspective exhibited by my Monthly Chart, my preferred scenario argues for a rangebound market above 3120 and below 3520 for 1 to 3 weeks ahead of another upleg that

Spot Gold is down 2% in the aftermath of the Israel-Iran conflict...What now?

From the Big Picture pattern perspective exhibited by my Monthly Chart, my preferred scenario argues for a rangebound market above 3120 and below 3520 for 1 to 3 weeks ahead of another upleg that
Mike Paulenoff (@mptrader) 's Twitter Profile Photo

From the perspective of my Big Picture Daily Chart setup, BTC looks poised for upside continuation after completing a correction from the ATH at 112,000 (5/22/25) to 98,300 (6/23/25). With the price structure above the 20 and 50 DMAs, and Daily Momentum pivoting sharply to the

From the perspective of my Big Picture Daily Chart setup, BTC looks poised for upside continuation after completing a correction from the ATH at 112,000 (5/22/25) to 98,300 (6/23/25). With the price structure above the 20 and 50 DMAs, and Daily Momentum pivoting sharply to the
Mike Paulenoff (@mptrader) 's Twitter Profile Photo

My chart of 2-year YIELD shows a decline from 3.79% to 3.74%, leaving it a full 64 bps below the Fed's official Fed funds rate (at least two 25 bps cuts), while my benchmark 10-year YIELD chart shows downside continuation to this AM's low at 4.26% (now at 4.27%). In other words,

Mike Paulenoff (@mptrader) 's Twitter Profile Photo

Benchmark 10-year YIELD is circling 4.26% as we speak (see my Hourly Chart), compared to yesterday's close at 4.25%. Here also, no reaction to a "hotter-than-expected" Core May PCE print, which leaves YIELD in the grasp of a May-June downtrend pattern. Only a climb and close

Benchmark 10-year YIELD is circling 4.26% as we speak (see my Hourly Chart), compared to yesterday's close at 4.25%. Here also, no reaction to a "hotter-than-expected" Core May PCE print, which leaves YIELD in the grasp of a May-June downtrend pattern. Only a climb and close
Mike Paulenoff (@mptrader) 's Twitter Profile Photo

The initial knee-jerk reaction of the bond market to the Senate passage of the Big Beautiful Bill from benchmark 10-year YIELD shows an up-spike in YIELD from a 9-week low at 4.21% to 4.27%. Let's see if YIELD can continue higher to close above 4.30%, where the upmove will

The initial knee-jerk reaction of the bond market to the Senate passage of the Big Beautiful Bill from benchmark 10-year YIELD shows an up-spike in YIELD from a 9-week low at 4.21% to 4.27%. Let's see if YIELD can continue higher to close above 4.30%, where the upmove will
Mike Paulenoff (@mptrader) 's Twitter Profile Photo

On the front burner this morning:  Much weaker than expected ADP Payrolls data for June (a loss of jobs, in fact!) released earlier this AM, BUT benchmark 10-year YIELD is climbing, suggesting that the Bond Vigilantes are actively "protesting" the spending levels included in the

On the front burner this morning:  Much weaker than expected ADP Payrolls data for June (a loss of jobs, in fact!) released earlier this AM, BUT benchmark 10-year YIELD is climbing, suggesting that the Bond Vigilantes are actively "protesting" the spending levels included in the
Mike Paulenoff (@mptrader) 's Twitter Profile Photo

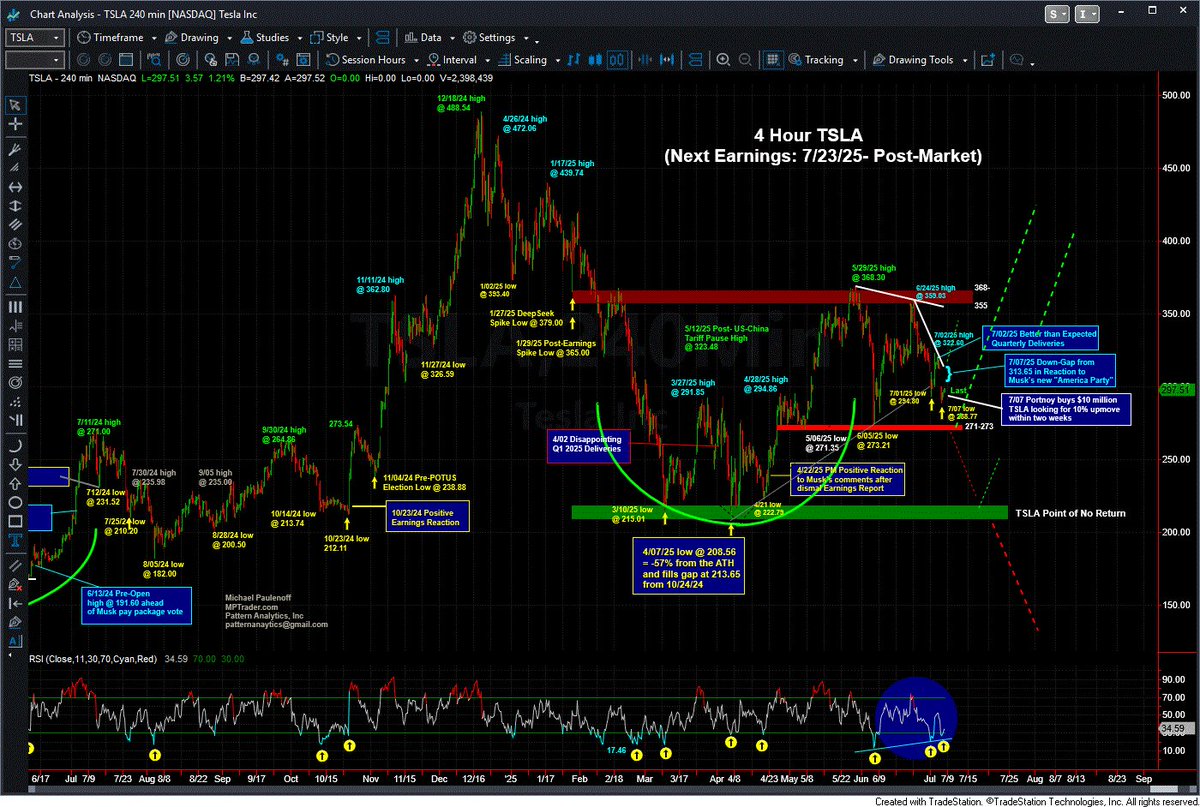
TSLA is down 7.75%, circling 290 compared with its 313.85 close last Thursday before Musk announced his America Party. My 4-hour chart shows the weakness is pressing toward a test of consequential multi-month support at 271-273 that must contain and reverse the weakness to avert

Mike Paulenoff (@mptrader) 's Twitter Profile Photo

$TSLA: Technically, my near-term pattern work indicates that the most recent downleg from the 6/24 rally high at 359.03 into yesterday's low at 288.77 has unfinished business to the downside UNLESS the current rally hurdles and sustains above 323.00. mptrader.com/p/analysis/TSL…

$TSLA: Technically, my near-term pattern work indicates that the most recent downleg from the 6/24 rally high at 359.03 into yesterday's low at 288.77 has unfinished business to the downside UNLESS the current rally hurdles and sustains above 323.00.  mptrader.com/p/analysis/TSL…
Mike Paulenoff (@mptrader) 's Twitter Profile Photo

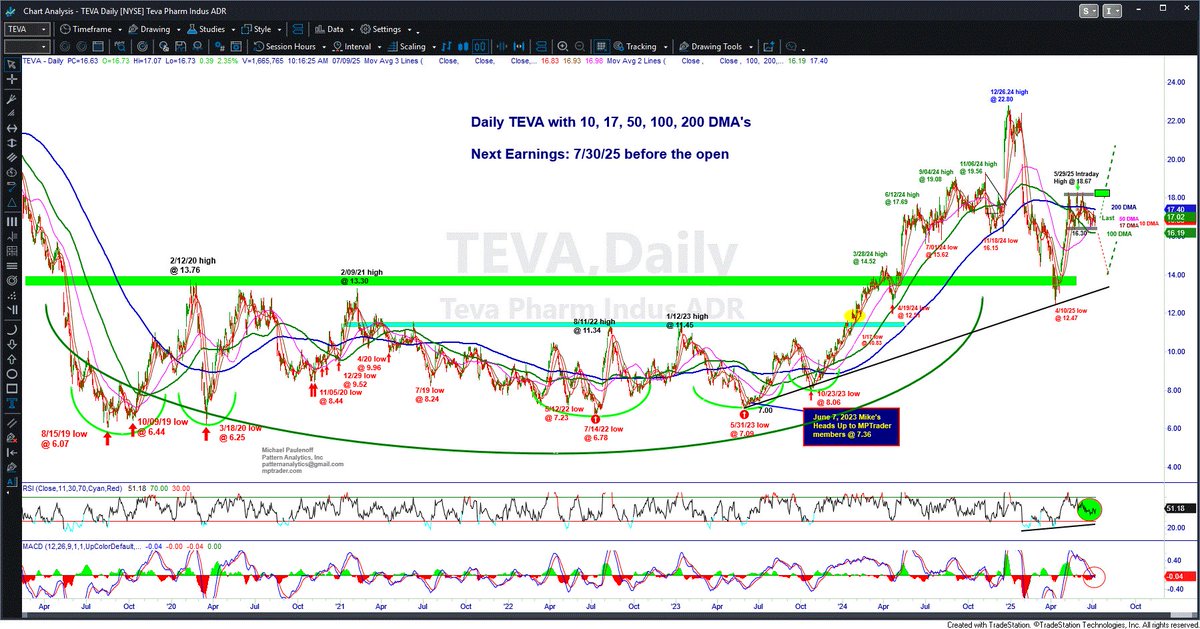
Bullish Digestion Setup for $TEVA Those of you who participated in the "rip-your-face-off" advance starting in June 2023 know that when TEVA embarks on a decisive directional move, the trend is TEVA investors' friend! My current setup work hints that at its April 2025 low of

Bullish Digestion Setup for $TEVA

Those of you who participated in the "rip-your-face-off" advance starting in June 2023 know that when TEVA embarks on a decisive directional move, the trend is TEVA investors' friend!

My current setup work hints that at its April 2025 low of
Mike Paulenoff (@mptrader) 's Twitter Profile Photo

My persistent bullish technical outlook in anticipation of $MP (Material Corp's) upside breakout from a two-year base-accumulation period and pattern has achieved most of its upside potential this AM, with a major announcement about the company's partnership with the Department

Mike Paulenoff (@mptrader) 's Twitter Profile Photo

Silver $SLV and Silver Mining ETF $SIL climbed to new pre-open highs this AM. SLV hit a 13-year new high at 35.55 while SIL hit a 5-year new high at 51.74.As long as any forthcoming acute weakness in SLV is contained above key support at 33.50-34.00, the dominant