Marc Reid (@marcreid) 's Twitter Profile
Marc Reid

@marcreid

Data analysis & visualisation | #Tableau Visionary | #Salesforce Certified | datavis.blog | youtube.com/@marcreid

ID: 826131117417910272

linkhttp://marcreid.me calendar_today30-01-2017 18:13:01

2,2K Tweet

2,2K Followers

987 Following
#30DayChartChallenge (@30daychartchall) 's Twitter Profile Photo

📣Coming in April! Exciting news! 📊 Get ready for the 4th edition of the #30DayChartChallenge 🥳 Stay tuned as we unveil the prompts next week. #dataviz

đź“ŁComing in April! Exciting news! đź“Š   

Get ready for the 4th edition of the #30DayChartChallenge 🥳

Stay tuned as we unveil the prompts next week.
#dataviz
Marc Reid (@marcreid) 's Twitter Profile Photo

Tableau Viz Extensions, available in the 2024.2 beta, are a real game changer. Video: bit.ly/3Wk6ZYg #tableau #data24 #dataviz

Tableau Viz Extensions, available in the 2024.2 beta, are a real game changer. 

Video: bit.ly/3Wk6ZYg

#tableau #data24 #dataviz
Tim Ngwena (@tableautim) 's Twitter Profile Photo

The biggest blow to hacks in a long while and I’m here for all of it! Can’t wait to try this in 2024.2 #tableau #data24 #tc24 #salesforce

Lisa Trescott (@lisatrescott) 's Twitter Profile Photo

I just watch Steven Franconeri's #Data24 session and it's amazing! Such an informative and entertaining presentation about visual processing of data visualization. Be sure to check it out. salesforce.com/plus/experienc…

Robbin Vernooij (@robbinvernooij) 's Twitter Profile Photo

Up next in the Explaining With series is Data Normalization and Percentile calculations in #Tableau showcasing some #NRL data to bring to life Z-Scores and Percentile ranks. github.com/Imba456/explai… Blog to follow once the #PowerBI equivalent is done!

Yuri Fal (@yurifal) 's Twitter Profile Photo

My take on XmR Charts (Process Control Charts). Rules : Outlier & Long Run (WE 1 & 4 / Nelson 1 & 2). Auto-recalculation of Central Line & Limits upon the Long Run. De-trending using Level / Trend Selector. public.tableau.com/views/XmR_YF/X…

Marc Reid (@marcreid) 's Twitter Profile Photo

đź‘€ didn't realise there were so many of these hidden functions in #Tableau. greatest(), least(), icontains()...

Sarah Bartlett (@sarahlovesdata) 's Twitter Profile Photo

I'm thrilled to announce that for the latest #IronQuest challenge, we're focusing on maps! Blog: sarahlovesdata.co.uk/2024/07/10/iro… In fact, we’ve partnered with the leaders of the brand-new Data+Maps TUG to showcase some of the #IronQuest submissions at their inaugural event on Aug 28th!

Raisa Hannus (@blu7ip) 's Twitter Profile Photo

Here's my experimental Dorling map for #Ironquest Maps II - World Population Metrics (data from #makeovermonday 2024/W6). đź”— t.ly/dcEDG Thank you Sarah Bartlett & co-hosts for the challenge, Tristan Guillevin for the Beeswarm & Michelle Frayman Nicole Klassen for the feedback!
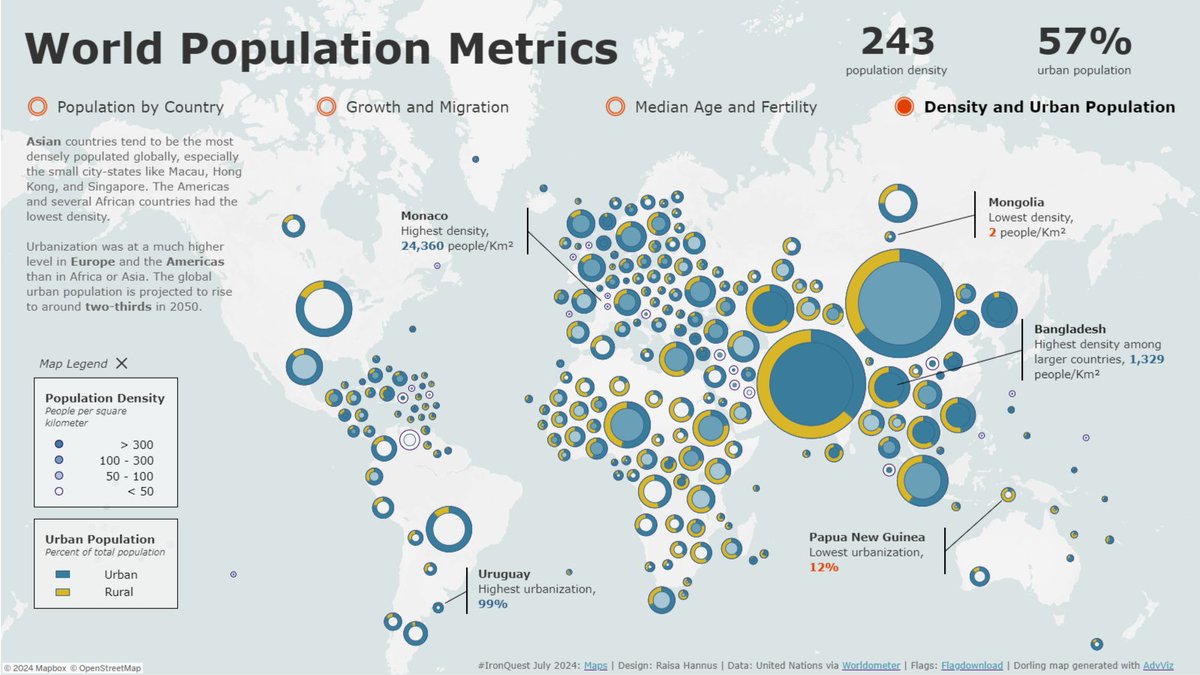
Here's my experimental Dorling map for #Ironquest Maps II - World Population Metrics (data from #makeovermonday 2024/W6).

 đź”— t.ly/dcEDG

Thank you <a href="/sarahlovesdata/">Sarah Bartlett</a> &amp; co-hosts for the challenge, <a href="/ladataviz/">Tristan Guillevin</a> for the Beeswarm &amp; <a href="/maf2k/">Michelle Frayman</a> <a href="/NicoleKlassen12/">Nicole Klassen</a> for the feedback!
Marc Reid (@marcreid) 's Twitter Profile Photo

Exploring South Korea's population density and demographics. (Updated with the latest World Bank data). Interact / download: public.tableau.com/views/SouthKor… #IronQuest #Tableau #dataviz #SouthKorea

Exploring South Korea's population density and demographics. (Updated with the latest World Bank data).

Interact / download: public.tableau.com/views/SouthKor… 

#IronQuest #Tableau #dataviz #SouthKorea
Seoyeon Jun đź“Š (@tableau_viz) 's Twitter Profile Photo

✅New Post : 5 Steps for User-Centric Dashboards This guide will elevate your dashboard from functional to impactful. medium.com/@tjdus92422/ma… Who 🤔: Who uses it? Why ❓: What decisions? What 📊: Key metrics? How 🔍: How do comparisons help? When 📅: Usage frequency?

âś…New Post : 5 Steps for User-Centric Dashboards

This guide will elevate your dashboard from functional to impactful.

medium.com/@tjdus92422/ma…

Who 🤔: Who uses it? 
Why âť“: What decisions? 
What đź“Š: Key metrics? 
How 🔍: How do comparisons help? 
When đź“…: Usage frequency?
Tableau Public (@tableaupublic) 's Twitter Profile Photo

Explore South Korea's population density and demographics with this #VizOfTheDay by Tableau Visionary Marc Reid. This #IronQuest map-themed viz uses the latest data from World Bank to showcase insights with a heat map, line charts, bar graphs, and more. tabsoft.co/3Lm5VMU

Explore South Korea's population density and demographics with this #VizOfTheDay by Tableau Visionary <a href="/marcreid/">Marc Reid</a>. 

This #IronQuest map-themed viz uses the latest data from World Bank to showcase insights with a heat map, line charts, bar graphs, and more.

tabsoft.co/3Lm5VMU
Tableau (@tableau) 's Twitter Profile Photo

With spatial parameters in Tableau 2024.3—geographical analysis is quicker and easier. Tableau Visionary Marc Reid shares tips, tricks, and helpful resources on mapping in Tableau with spatial parameters and the latest spatial calculations. Learn more: tabsoft.co/4erbBBq