profile-img
Maria Olczak πŸ‡ΊπŸ‡¦

@mar_olczak

Methane policy-tech nexus @OxfordEnergy @EnvDefenseEuro @QMULSEMS Formerly @EUI_FSR @coenatolin alumna. Views are my own, RTs not endorsements.

calendar_today16-09-2017 14:28:05

1,3K Tweets

721 Followers

684 Following

Maria Olczak πŸ‡ΊπŸ‡¦(@mar_olczak) 's Twitter Profile Photo

Methane – the 2nd biggest driver of global warming after COβ‚‚ – remains underregulated.

But what policies are already in place, and what's their impact?πŸ€”

Here are key insights from our global review of policies: cell.com/one-earth/full…

QMUL School of Engineering and Materials Science Environmental Defense Fund Europe

🧡

account_circle
Maria Olczak πŸ‡ΊπŸ‡¦(@mar_olczak) 's Twitter Profile Photo

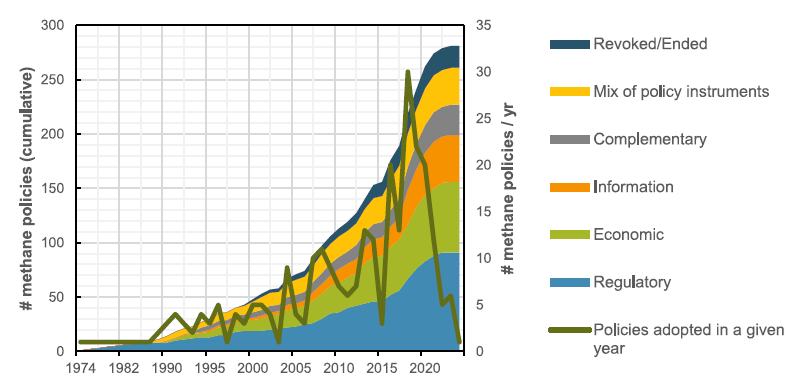
1/n We started by creating a policy inventory with 650+ policies, then reduced the number to 281 relevant policies adopted since the 1970s, incl. 255 policies that are currently in force and were the key focus of our analysis.

1/n We started by creating a policy inventory with 650+ policies, then reduced the number to 281 relevant policies adopted since the 1970s, incl. 255 policies that are currently in force and were the key focus of our analysis.
account_circle
Maria Olczak πŸ‡ΊπŸ‡¦(@mar_olczak) 's Twitter Profile Photo

2/n Defining methane policies is challenging, bc methane is regulated for different reasons: climate change, air quality, safety, energy resource management, and energy security, e.g. coalbed methane capture and use.

account_circle
Maria Olczak πŸ‡ΊπŸ‡¦(@mar_olczak) 's Twitter Profile Photo

3/n We defined methane policies as actions by governments explicitly aiming to monitor, prevent, or reduce CH4 from man-made sources. We included policies that do not explicitly regulate methane emissions but have a material impact on methane emission reduction e.g., landfill reg

account_circle
Maria Olczak πŸ‡ΊπŸ‡¦(@mar_olczak) 's Twitter Profile Photo

4/n ...but excluded policies with no immediate and material effect e.g. land use change policies and policies adopted by the companies, incl. NOCs.

account_circle
Maria Olczak πŸ‡ΊπŸ‡¦(@mar_olczak) 's Twitter Profile Photo

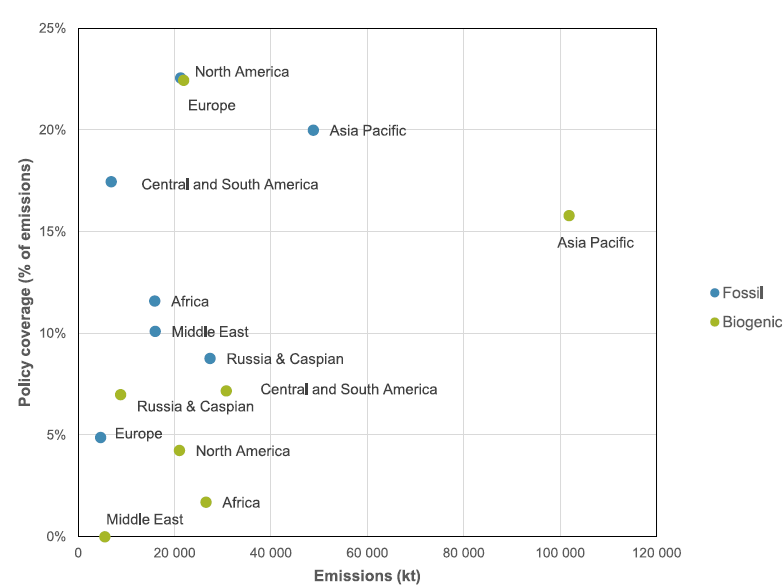
5/n We found that only around 13% (min. 10% - max. 17%) of methane emissions across key sources – agriculture, waste and energy – is covered by direct mitigation policies, with significant differences across regions and across biogenic and fossil sources of emissions.

5/n We found that only around 13% (min. 10% - max. 17%) of methane emissions across key sources – agriculture, waste and energy – is covered by direct mitigation policies, with significant differences across regions and across biogenic and fossil sources of emissions.
account_circle