Lesley-Anne Kelly (@l_a_kelly) 's Twitter Profile
Lesley-Anne Kelly

@l_a_kelly

Head of data journalism📈 at DC Thomson.
Feed my data habit - ✉️ [email protected]

ID: 927995343844921345

calendar_today07-11-2017 20:25:06

6,6K Tweet

1,1K Takipçi

1,1K Takip Edilen

Laura Young (@lesswastelaura) 's Twitter Profile Photo

These photos were taken just one day apart. I reported this fly tipping on the FixMyStreet app and Dundee City Council cleared it swiftly. Community reporting apps such as this are a great way for communities to see change in their local area and improve the environment!
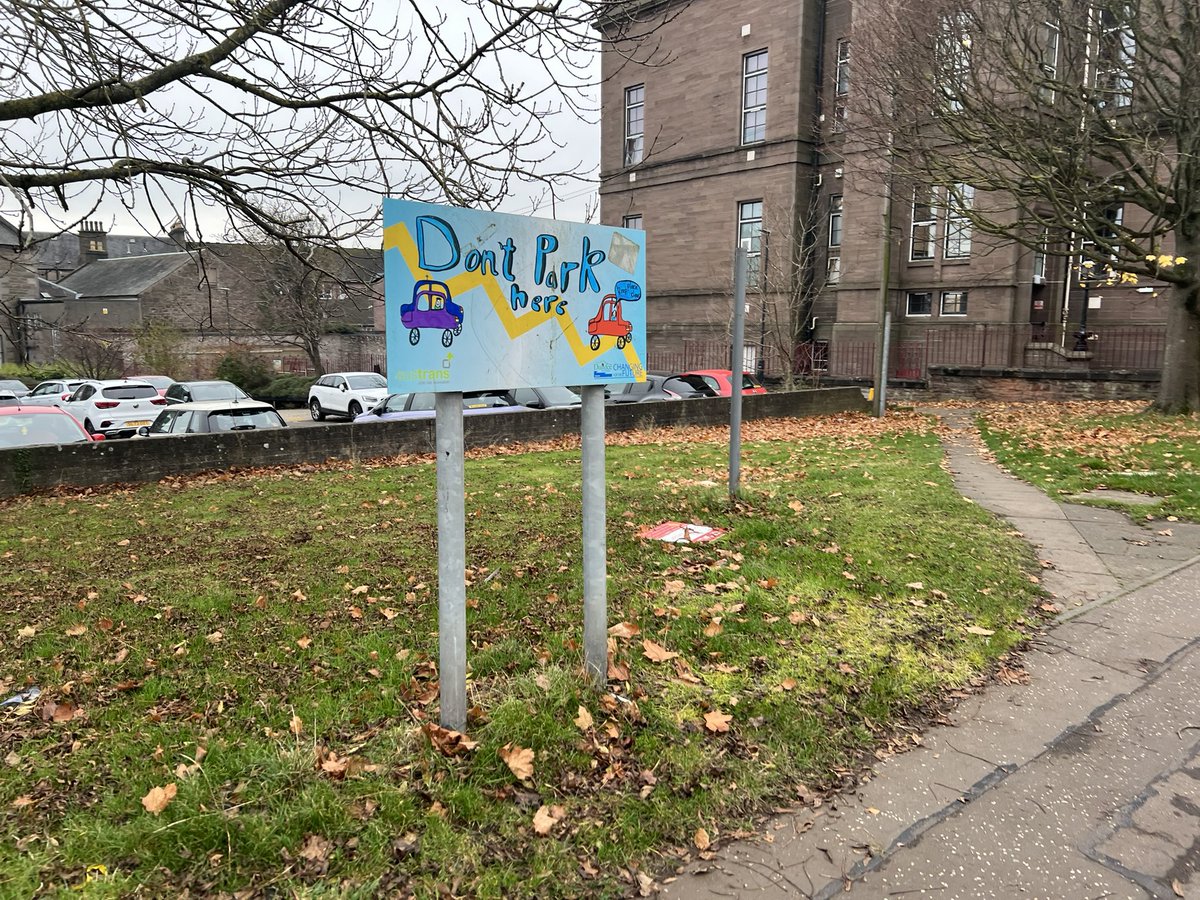
These photos were taken just one day apart. I reported this fly tipping on the <a href="/fixmystreet/">FixMyStreet</a> app and <a href="/DundeeCouncil/">Dundee City Council</a> cleared it swiftly. Community reporting apps such as this are a great way for communities to see change in their local area and improve the environment!
Lesley-Anne Kelly (@l_a_kelly) 's Twitter Profile Photo

Been absolutely dying to share this. Racket charts, tennis ball scatter plots, top trumps cards🎾😍 judy murray I hope we did your son proud! #ddj #datajournalism #dataviz

Lesley-Anne Kelly (@l_a_kelly) 's Twitter Profile Photo

Latest part of our series is a tribute to those who lost their lives from Ross Hempseed He trawled through clippings and reports to compile details on all of the lives lost in recent years.

Ema Sabljak (@emasabljak) 's Twitter Profile Photo

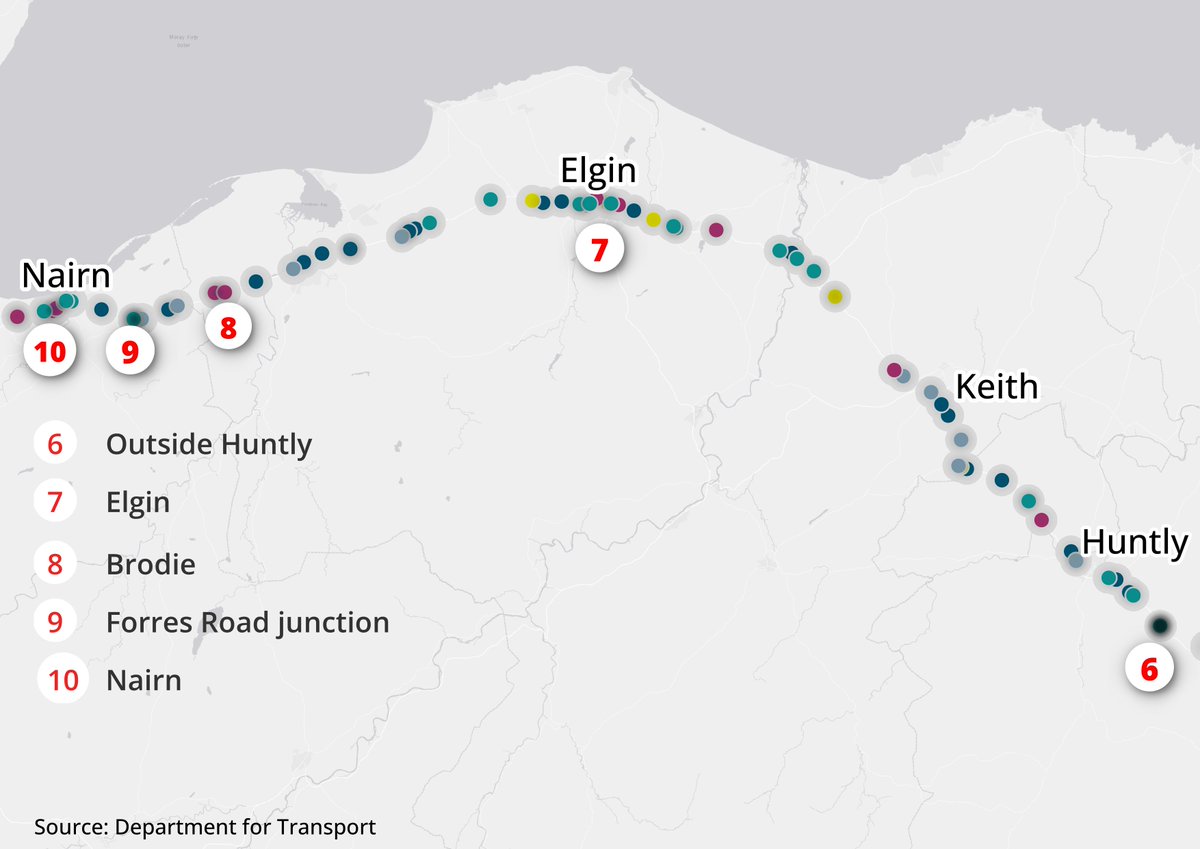
We have analysed when crashes happen on the A96, but today we want to provide a better answer for the question of where they happen. Using QGIS I created a heatmap along the road from Aberdeen to Inverness showing clustered accident blackspots. 1/4 #dataviz

We have analysed when crashes happen on the A96, but today we want to provide a better answer for the question of where they happen.  Using QGIS I created a heatmap along the road from Aberdeen to Inverness showing clustered accident blackspots. 1/4 #dataviz
Ema Sabljak (@emasabljak) 's Twitter Profile Photo

The heatmap is based on the density of crashes within a one-kilometre radius. Larger numbers or more closely clustered crashes within that radius appear with a darker shade, like this one found near Morgan McVeighs restaurant in Insch with three crashes. 2/4 #ddj #datajournalism

The heatmap is based on the density of crashes within a one-kilometre radius. Larger numbers or more closely clustered crashes within that radius appear with a darker shade, like this one found near Morgan McVeighs restaurant in Insch with three crashes. 2/4 #ddj #datajournalism
Ema Sabljak (@emasabljak) 's Twitter Profile Photo

The article also takes a closer look at how many crashes happen in rural versus urban sections of the road. Once again QGIS was use to find all the crashes overlapping with or immediately adjacent to settlements defined by Scottish Government Spatial Data on Localities. 3/4

The article also takes a closer look at how many crashes happen in rural versus urban sections of the road. Once again QGIS was use to find all the crashes overlapping with or immediately adjacent to settlements defined by Scottish Government Spatial Data on Localities. 3/4