Jonathan Harrier, CMT (@jonathanharrier) 's Twitter Profile
Jonathan Harrier, CMT

@jonathanharrier

I post charts, backtests, trade strategies, and journal thoughts on abnormal market events. Nothing is advice, just information.

ID: 316540936

calendar_today13-06-2011 16:12:49

3,3K Tweet

8,8K Followers

86 Following

Jonathan Harrier, CMT (@jonathanharrier) 's Twitter Profile Photo

There is an element of Stoic application in disciplined trading, finding its basis in a disciplined mind. Control what you can, don’t get worked up about the rest.

Jonathan Harrier, CMT (@jonathanharrier) 's Twitter Profile Photo

$KC $VNET Big relative strength today in China data centers. Up around 10% on news of DeepSeek releasing advanced Math AI. When DeepSeek first startied making news, it created monster runs for these data centers.

$KC $VNET Big relative strength today in China data centers.  Up around 10% on news of DeepSeek releasing advanced Math AI.  

When DeepSeek first startied making news, it created monster runs for these data centers.
Jonathan Harrier, CMT (@jonathanharrier) 's Twitter Profile Photo

It's an "inconvenient truth" that the best days happen in close proximity to the worst. 30% of $SPX stocks were at a 52-week low on April 8. That level happened 25 other times since 1985. $SPX average gain a year later was 30.6%.

Jonathan Harrier, CMT (@jonathanharrier) 's Twitter Profile Photo

I just found out that the new Pope got a bachelor’s degree in MATH. So he surely must understand sin quite well. (and also cos, tan, etc)

Jonathan Harrier, CMT (@jonathanharrier) 's Twitter Profile Photo

$TMDX - shot higher today, post blowout earnings report - now above Brian Shannon, CMT AVWAP from all time high (weekly) - AVWAP curling up here, now turning to support vs. prior resistance

$TMDX
- shot higher today, post blowout earnings report
- now above <a href="/alphatrends/">Brian Shannon, CMT</a> AVWAP from all time high (weekly)
- AVWAP curling up here, now turning to support vs. prior resistance
Jonathan Harrier, CMT (@jonathanharrier) 's Twitter Profile Photo

I see a lot of event driven price studies posted here, but few ever list drawdowns. I guess that goes with life, people just want to focus on good times. But that’s not real life. We have to learn to deal with the downside, minimize it when possible. But don’t ignore it.

Jonathan Harrier, CMT (@jonathanharrier) 's Twitter Profile Photo

There are different ways of looking at things. But be consistent and simple with your approach. You can use MAs in trend alignment, or even an anchored VWAP. Both can show where there's resistance. Breaking above can be a significant area of interest. $CMG

There are different ways of looking at things.  But be consistent and simple with your approach.  You can use MAs in trend alignment, or even an anchored VWAP.  Both can show where there's resistance.  Breaking above can be a significant area of interest. 
$CMG
Jonathan Harrier, CMT (@jonathanharrier) 's Twitter Profile Photo

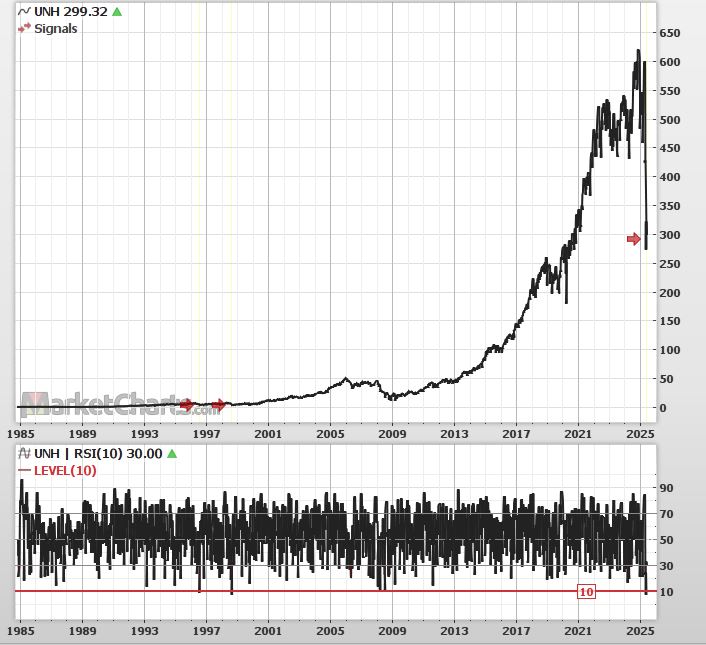
$UNH Really nasty selloffs are intriguing. Capitulation events, in the indexes or individual names can present opportunities for big R:R tradeoffs. The latest with $UNH is one that stands out to me. Only 3 times in history when its RSI(10) was below 10.

$UNH 
Really nasty selloffs are intriguing.  Capitulation events, in the indexes or individual names can present opportunities for big R:R tradeoffs.  The latest with $UNH is one that stands out to me.  Only 3 times in history when its RSI(10) was below 10.
Jonathan Harrier, CMT (@jonathanharrier) 's Twitter Profile Photo

Some truths obscure others. While the *average* net worth is $1.2 million, the *median* in the U.S. is closer to $210,000 according to the Fed's Distribution of Wealth report.

Jonathan Harrier, CMT (@jonathanharrier) 's Twitter Profile Photo

There was only 1 stock in the US (any exchange) that in the past month had: - price > $10 - avg daily volume > 100,000 shares - RSI(10) that crossed above 10 from below $UNH Pretty amazing that a $270B company is the only stock with these criteria. Scan via MarketCharts.com

There was only 1 stock in the US (any exchange) that in the past month had: 
- price &gt; $10 
- avg daily volume &gt; 100,000 shares
- RSI(10) that crossed above 10 from below
$UNH
Pretty amazing that a $270B company is the only stock with these criteria.
Scan via <a href="/MarketCharts/">MarketCharts.com</a>
Jonathan Harrier, CMT (@jonathanharrier) 's Twitter Profile Photo

$TMDX daily - Stabilizing here after cleaning the window from last fall. - Holding 10-ma very well for two months - 20/50 ma rising rapidly - Short % of float >40% (has been high for a while)

$TMDX daily
- Stabilizing here after cleaning the window from last fall.  
- Holding 10-ma very well for two months
- 20/50 ma rising rapidly
- Short % of float &gt;40% (has been high for a while)
Jonathan Harrier, CMT (@jonathanharrier) 's Twitter Profile Photo

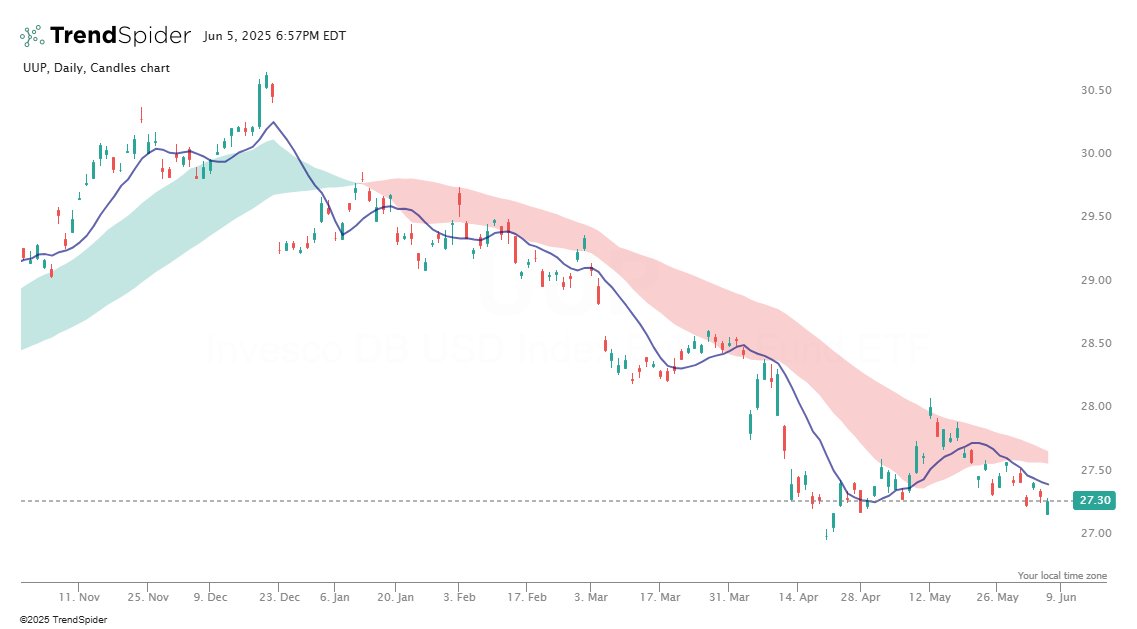
$UUP $DXY Dollar down is the trend. And people with any international exposure in their portfolio should smile at this. It is a tailwind for ex-US holdings. It's part of the reason why all the ex-US indices are at all time highs. If this is a new cycle, it's a big deal.

$UUP $DXY
Dollar down is the trend. And people with any international exposure in their portfolio should smile at this.  It is a tailwind for ex-US holdings.

It's part of the reason why all the ex-US indices are at all time highs. 

If this is a new cycle, it's a big deal.