jcritchley (@jcritchley_) 's Twitter Profile
jcritchley

@jcritchley_

Map Design @mapbox

ID: 32090246

linkhttp://jonathancritchley.ca calendar_today16-04-2009 18:52:51

1,1K Tweet

1,1K Takipçi

4,4K Takip Edilen

Omar Shehata (@omar4ur) 's Twitter Profile Photo

I built the interface I wanted to see when the Google Earth 3D Tiles thing first came out: (1) select a map region (2) get a single glTF file normalized around (0,0,0) that you can just pop in Blender/ThreeJS/any 3D engine! Here it's in Three.js omarshehata.github.io/google-earth-a…

Peter Atwood (@peterincan) 's Twitter Profile Photo

After much procrastinating, I've put together a tutorial covering my process for getting geospatial data into Blender and animating it with geometry nodes. peteratwoodprojects.wordpress.com/2024/01/26/map… #blender3d #maps #gis

Bert Spaan (@bertspaan) 's Twitter Profile Photo

Allmaps now supports MapLibre GL MapLibre ⚡⚡ See observablehq.com/@allmaps/mapli… for an interactive example. (There are plugins for OpenLayers and Leaflet as well!)

KK Rebecca Lai (@kkrebeccalai) 's Twitter Profile Photo

April 8 is eclipse day🌑🌞! If you're planning to watch it, use our handy tool to see what historical cloud cover was like at your location. We will update this page with real weather forecast data closer to the day of. w/ Josh Katz William B. Davis nytimes.com/interactive/20…

Nami Sumida (@namisumida) 's Twitter Profile Photo

Mass incarceration of Japanese Americans during WWII devastated SF's Japantown - what was once a rich, thriving neighborhood for Japanese Americans For the first time, we can visualize how disastrous a 1942 order was on the community San Francisco Chronicle sfchronicle.com/projects/2024/…
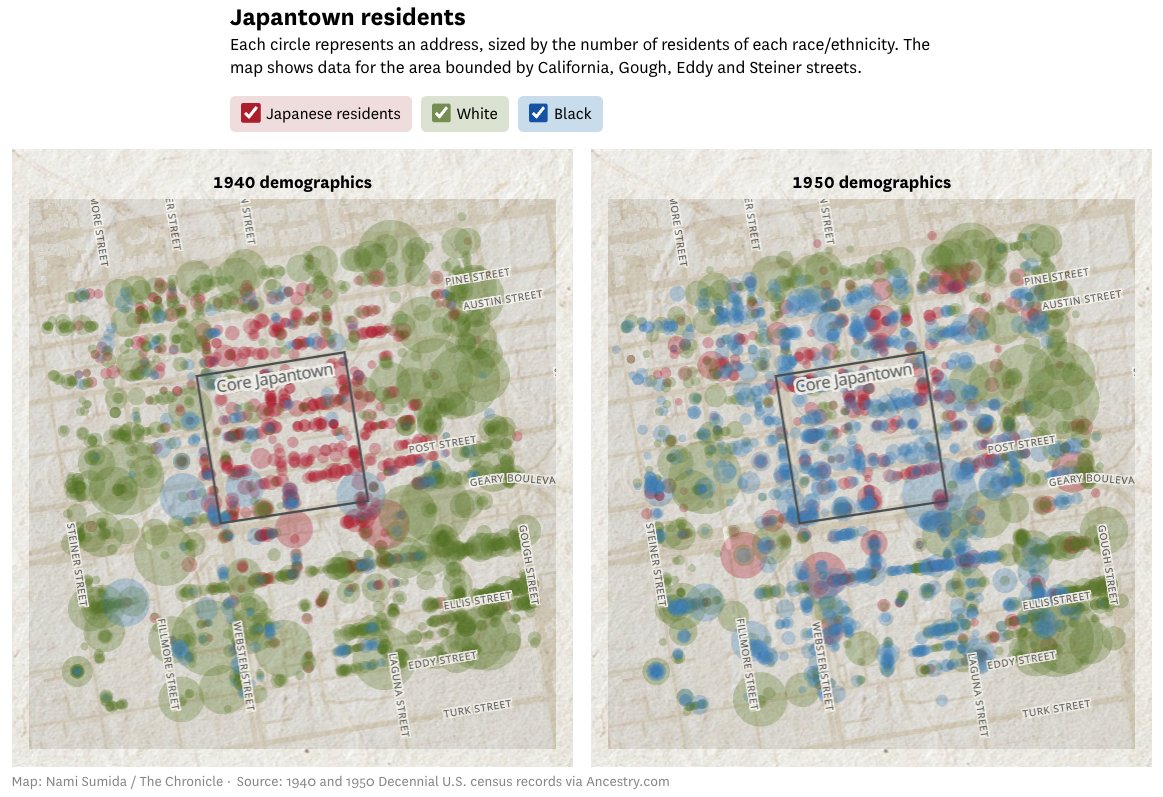
Mass incarceration of Japanese Americans during WWII devastated SF's Japantown - what was once a rich, thriving neighborhood for Japanese Americans

For the first time, we can visualize how disastrous a 1942 order was on the community <a href="/sfchronicle/">San Francisco Chronicle</a> 

sfchronicle.com/projects/2024/…
Kyle Barron kylebarron.dev on bsky (@kylebarron2) 's Twitter Profile Photo

In just a few lines of Python code, query Overture Maps Foundation buildings and plot them with Lonboard. Making use of the latest work in GeoParquet. New example: developmentseed.org/lonboard/lates…

Robin Hawkes (@robhawkes) 's Twitter Profile Photo

Excited to share a visual that I worked on last year… It's an interactive timelapse of Intelligent Octopus EV charging patterns, alongside electricity generation outturn and carbon intensity 🚗⚡🍃 Play for yourself 👇 octopus.energy/smart-energy-e…

Future Model Toronto (@futuremodelto) 's Twitter Profile Photo

Excited to share Precondo 3D from Precondo / jordon — an interactive new way to explore pre-construction development from any web browser (a lite-version of Future Model Toronto with useful project data built-in). Try it now: precondo.ca/3d-model-toron… #Toronto #ToRE

Excited to share Precondo 3D from <a href="/precondo_ca/">Precondo</a> / <a href="/ScrinkoCa/">jordon</a> — an interactive new way to explore pre-construction development from any web browser (a lite-version of Future Model Toronto with useful project data built-in). Try it now: precondo.ca/3d-model-toron…

#Toronto #ToRE
James Milner (@jameslmilner) 's Twitter Profile Photo

You might think the geodesic circles 'look weird' - here's what they look like when you draw them onto a globe. Makes sense now right? 😅

Chris Whong (@chris_whong) 's Twitter Profile Photo

I made a Mapbox GL JS plugin to show a little globe minimap to show the main map's center point. Made with D3.js. github.com/chriswhong/map…

Ate Poorthuis (@atepoorthuis) 's Twitter Profile Photo

Ever wanted to research mobility patterns but no idea where to start looking for data? Qingqing Chen, Matthew Zook and I are releasing a dataset originally based on geotagged social media posts by 2 mln users across the US, containing 1.2 bln data points sent between 2012-2019.

Ever wanted to research mobility patterns but no idea where to start looking for data? <a href="/qingqingchen77/">Qingqing Chen</a>, <a href="/mattzook/">Matthew Zook</a>  and I are releasing a dataset originally based on geotagged social media posts by 2 mln users across the US, containing 1.2 bln data points sent between 2012-2019.
Qiusheng Wu (@giswqs) 's Twitter Profile Photo

📢 Exciting news! Leafmap now supports creating 3D 🌎 maps with Mapbox! This demo showcases how to visualize the ESA global land cover from #EarthEngine on a 3D globe. Explore the 100 PB+ Earth Engine Data Catalog and display any geospatial datasets in 3D 🚀 Notebook:

Ian Bott (@ian_bott_artist) 's Twitter Profile Photo

I enjoy a visual challenge and this was a tricky one from the Financial Times's visual storytelling team: create a 3D view of Canary Wharf but have it rotate up from the iconic skyline when the reader scrolls down

Taylor Baldwin (@taylorbaldwin) 's Twitter Profile Photo

Spent the last few weeks parsing NYC's massive 2017 lidar dataset (almost 1TB of data) and segmenting them by building. Now you can select any of NYC's more than 1M buildings and see its point cloud. #webgpu