Jan Willem Tulp (@janwillemtulp) 's Twitter Profile
Jan Willem Tulp

@janwillemtulp

Datavizioneer @ TULP interactive

@tulpinteractive.com on BlueSky
@[email protected]

creativedataviz.com
pinterest.com/janwillemtulp

ID: 21084111

linkhttps://tulpinteractive.com calendar_today17-02-2009 12:20:53

23,23K Tweet

13,13K Takipçi

1,1K Takip Edilen

Karim Douïeb (@karim_douieb) 's Twitter Profile Photo

For what it’s worth: an alternative view on the 2024 U.S. Election Map 🗳️ This map scales states by electoral weight, preserving the U.S. shape for recognition. Voronoi-based shapes within each state show exact elector counts. #Election2024 #DataViz #Cartogram #ElectoralCollege

Jan Willem Tulp (@janwillemtulp) 's Twitter Profile Photo

The #dataviz community over at bluesky is pretty nice and growing steadily... just sayin'... Here's a #dataviz starter pack to get started (by Voilà: Francis Gagnon): go.bsky.app/R3nSyyy And if you want to follow me there: bsky.app/profile/tulpin… 🦋

Jan Willem Tulp (@janwillemtulp) 's Twitter Profile Photo

I am on Blue Sky, and much of the #dataviz community too. You should join too if you haven't yet! bsky.app/profile/tulpin… 🦋

Visualizing Knowledge (@vizknowledge) 's Twitter Profile Photo

VK25 is coming! Join us in Finland on June 6th for "Visualizing Resilience" — exploring adaptation, patterns, and hope through data design. Open calls for speakers & showcases now live! More info via link in bio. #dataviz #informationdesign #conference #aaltouniversity #finland

Vincent D. Warmerdam (@fishnets88) 's Twitter Profile Photo

I released a minor update to drawdata so that some buttons render better. Small update, but super helpful library in case you've not used it. You can learn more on the git repo here: github.com/koaning/drawda…

Jan Willem Tulp (@janwillemtulp) 's Twitter Profile Photo

End of last year I had a lot of fun with a #sideproject creating an oil painting simulation that paints a photo you upload. Still lots of improvements possible, but quite alright results. (video sped up 8x)

data.europa.eu (@eu_opendata) 's Twitter Profile Photo

📱 Participate in the EU Open Data Days to harness the full potential of open data. Discuss data accessibility and interoperability solutions. Share insights on making data more reusable and on training AI systems. Register today 👉 europa.eu/!kbF3Dg #EUOpenData

📱 Participate in the EU Open Data Days to harness the full potential of open data. Discuss data accessibility and interoperability solutions. 

Share insights on making data more reusable and on training AI systems. 

Register today 👉 europa.eu/!kbF3Dg

#EUOpenData
Visualizing Knowledge (@vizknowledge) 's Twitter Profile Photo

Remember to submit your proposal for our open call! We welcome submissions from all over the world, for a chance to be selected as part of the VK25 speakers list. For more information on how to apply go to the bio link or vizknowledge.aalto.fi/SpeakerOpencal… #dataviz #informationdesign

Remember to submit your proposal for our open call! We welcome submissions from all over the world, for a chance to be selected as part of the VK25 speakers list. For more information on how to apply go to the bio link or vizknowledge.aalto.fi/SpeakerOpencal…

#dataviz #informationdesign
data.europa.eu (@eu_opendata) 's Twitter Profile Photo

Very insightful to hear Jan Willem Tulp again on how the design of data visualisation plays a critical role in how information is interpreted and communicated. He explains how design elements, such as colour, scale, and focus, can shape narratives and introduce biases. 1/2
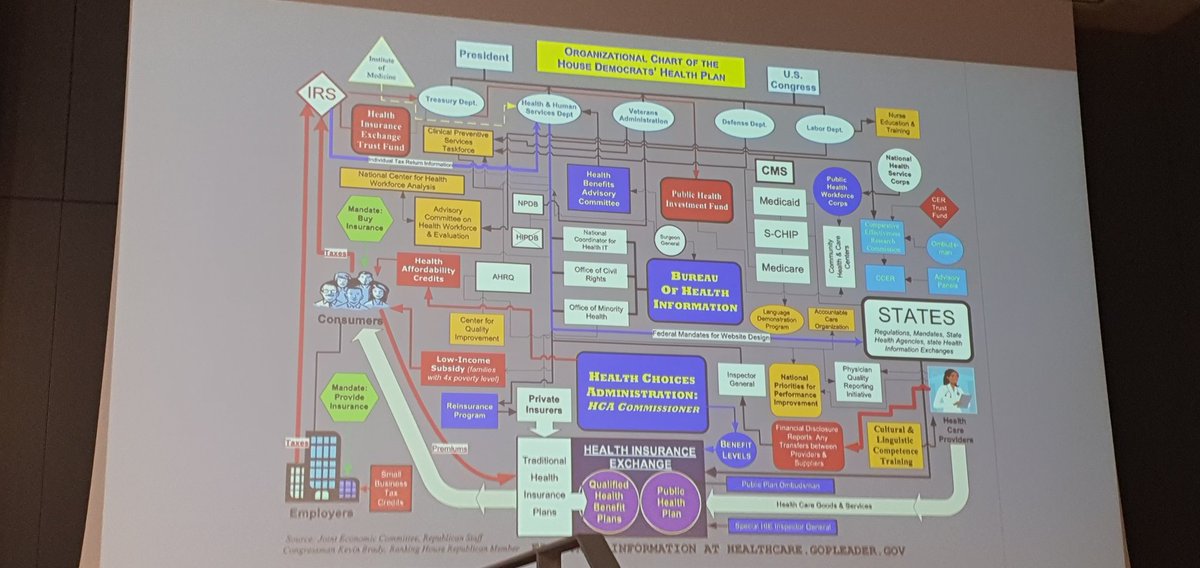
Very insightful to hear <a href="/JanWillemTulp/">Jan Willem Tulp</a>  again on how the design of data visualisation plays a critical role in how information is interpreted and communicated. He explains how design elements, such as colour, scale, and focus, can shape narratives and introduce biases.

1/2
data.europa.eu (@eu_opendata) 's Twitter Profile Photo

2/2 Through case studies such as the atlas of sustainable development goals, Jan Willem Tulp highlights the responsibilities of data visualisers to maintain transparency while crafting compelling visual narratives. Very inspiring projects! Follow live: europa.eu/!XcKxWf

2/2
Through case studies such as the atlas of sustainable development goals, <a href="/JanWillemTulp/">Jan Willem Tulp</a> highlights the responsibilities of data visualisers to maintain transparency while crafting compelling visual narratives. Very inspiring projects!

Follow live: europa.eu/!XcKxWf