SwingGraphs (@swinggraphs) 's Twitter Profile
SwingGraphs

@swinggraphs

Proprietary Vertical Bat Angle (VBA) Data. Swing Path Scores of MLB & MiLB Hitters | @QuantTee | Researcher, Author - Quantitative Hitting.

ID: 1220152944877821953

linkhttps://swinggraphs.com/ calendar_today23-01-2020 01:15:14

913 Tweet

5,5K Takipçi

465 Takip Edilen

SwingGraphs (@swinggraphs) 's Twitter Profile Photo

As we start looking for hitter surprises next year, keep an eye on Trevor Larnach. Scores for path/power/plate/btb are: 98/87/73/92 - Overall 89 Power & btb skill improving, solid path. We expect him to be well above avg next year Also, the updates for Sept are posted

SwingGraphs (@swinggraphs) 's Twitter Profile Photo

For the past several years, (most) projection systems have failed to predict A. Judge as the best hitter in MLB. He has outperformed the 2nd best hitter by *wide* margins Looking at doing wOBA projections (if we can do better than most) - stay tuned

For the past several years, (most) projection systems have failed to predict A. Judge as the best hitter in MLB. He has outperformed the 2nd best hitter by *wide* margins

Looking at doing wOBA projections (if we can do better than most) - stay tuned
SwingGraphs (@swinggraphs) 's Twitter Profile Photo

On Chapman - power is great and other skills are all well above average (except swing path which is poor). We view the 2025 Steamer projections of .332/115 for wOBA/wRC+ as about right.

SwingGraphs (@swinggraphs) 's Twitter Profile Photo

A lot of potential swing changes on tap when we do the update at the end of the month Corbin Carroll-Attack Angle seems to be up-and he's absolutely blistering the ball (6th in EV) For MLB overall, bat speeds are unchanged but EVs are up .5 MPH. Ball changes? or Bat changes?

SwingGraphs (@swinggraphs) 's Twitter Profile Photo

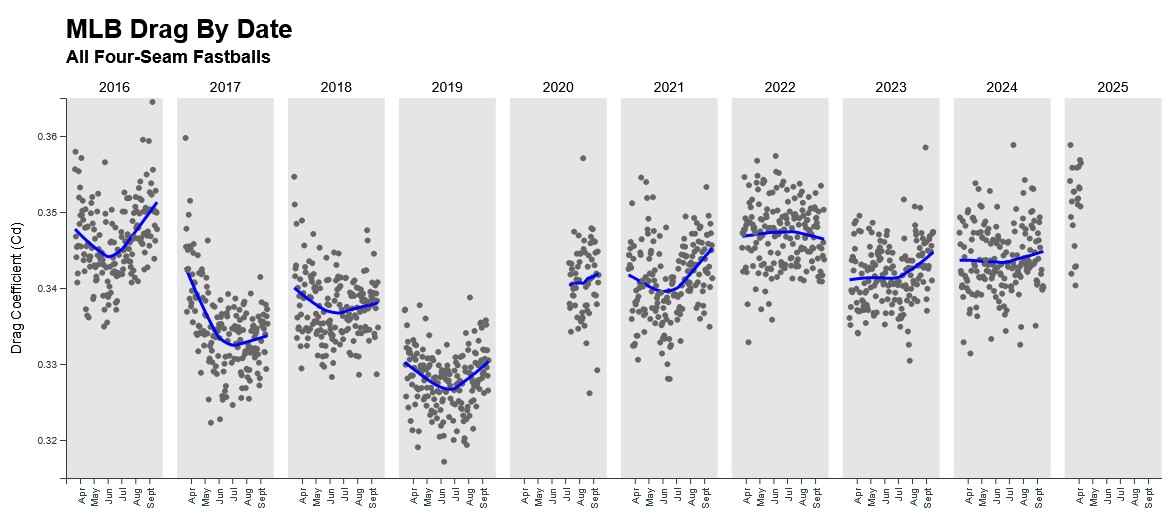
Looks like there are likely *major* changes to the MLB ball this year. It looks like the COR (bounce off the bat) is way up BUT-drag is also way up. Sure, it's just a quick summary (and warmer weather will impact) but the SLG difference is eye-popping. Why keep messing with it??

Looks like there are likely *major* changes to the MLB ball this year. It looks like the COR (bounce off the bat) is way up  BUT-drag is also way up. Sure, it's just a quick summary (and warmer weather will impact) but the SLG difference is eye-popping. Why keep messing with it??
SwingGraphs (@swinggraphs) 's Twitter Profile Photo

Got a lot of comments wanting apples to apples for Mar/Apr. Just found this on bbsavant. Mar/Apr drag looks to be close to the highest ever..definitely up over last year

Got a lot of comments wanting apples to apples for Mar/Apr. Just found this on bbsavant. Mar/Apr drag looks to be close to the highest ever..definitely up over last year
SwingGraphs (@swinggraphs) 's Twitter Profile Photo

VBA, Path Scores, MiLB data and EVI_CQ have been updated on the site. The rest is coming.. Some very big changes: -Spencer Torkelson - unbelievable! VBA up avg of 7.9 deg. Path is now top 10%+ in MLB -T. Larnach - VBA down 4.3 deg and path score has dropped significantly

SwingGraphs (@swinggraphs) 's Twitter Profile Photo

Roman Anthony has the top overall SG Score in MiLB. Granted only 67 batted balls - but he's showing the following (for Path/Power/Plate/Bat-to-Ball) 96/95/94/81 - Overall 92 He also has the 2nd highest barrel rate in MiLB at 32.8%

SwingGraphs (@swinggraphs) 's Twitter Profile Photo

The new statcast metrics are great..but the Ideal Attack Angle % has zero correlation to performance/contact quality. A quick thread...

The new statcast metrics are great..but the Ideal Attack Angle % has zero correlation to performance/contact quality. 

A quick thread...
SwingGraphs (@swinggraphs) 's Twitter Profile Photo

We've talked about the problem of designing metrics based on what 'seems to work' based on logic. The problem is, you can't see all the relationships and which ones trump others. In this case, the outcome is not what is expected as higher ideal % results in lower sweet spot %

We've talked about the problem of designing metrics based on what 'seems to work' based on logic. The problem is, you can't see all the relationships and which ones trump  others. In this case, the outcome is not what is expected as higher ideal % results in lower sweet spot %
SwingGraphs (@swinggraphs) 's Twitter Profile Photo

They key 'unseen' metric (and there may be other relationships that are impacting as well) is that Ideal Attack Angle goes down as Vertical Swing Angle goes up. VSA is a very important factor in overall contact quality - particularly when normalizing for EV/bat speed

They key 'unseen' metric (and there may be other relationships that are impacting as well) is that Ideal Attack Angle goes down as Vertical Swing Angle goes up. VSA is a very important factor in overall contact quality - particularly when normalizing for EV/bat speed
SwingGraphs (@swinggraphs) 's Twitter Profile Photo

Devising drills based on surface level logic will often times take you in the wrong direction.. Flatter bat means more north/south launch angle variability and reduces performance. MLB has all the bat data now so there are no excuses for thinking *your* drills actually work

SwingGraphs (@swinggraphs) 's Twitter Profile Photo

Data update for June is up on the site. R. Acuna's scores showing 3rd best overall in MLB. ..also, an MiLB sleeper- not many tracked batted balls so grain of salt but Parks Harber could do much better than expectations - which are *extremely* low -not even on the prospect board