R for Political Science (@stats_map) 's Twitter Profile
R for Political Science

@stats_map

I post mainly about R packages and data sources for political science analysis.

ID: 1270179280731820032

linkhttp://rforpoliticalscience.com calendar_today09-06-2020 02:22:05

597 Tweet

3,3K Takipçi

317 Takip Edilen

Joachim Schork (@joachimschork) 's Twitter Profile Photo

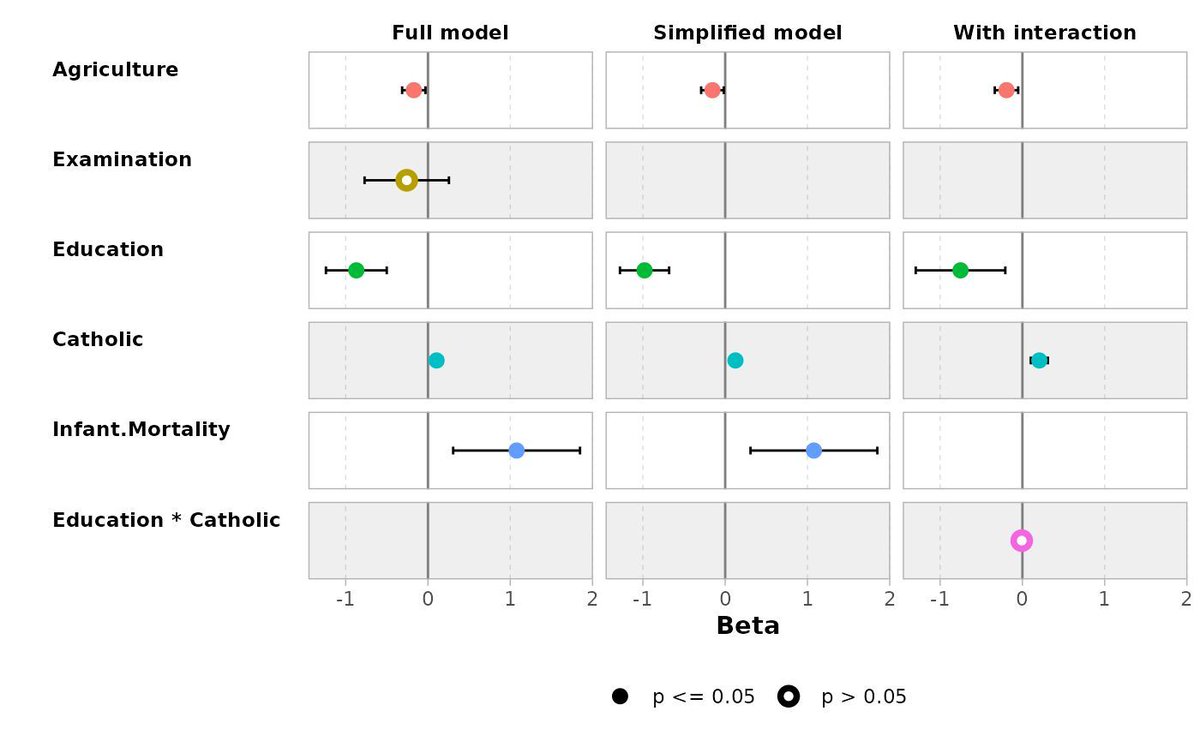
Compare multiple statistical models effortlessly with ggstats, a versatile extension package for ggplot2 that simplifies data visualization tasks. The ggcoef_compare() function allows you to compare the coefficients of several models side by side, providing an intuitive way to

Compare multiple statistical models effortlessly with ggstats, a versatile extension package for ggplot2 that simplifies data visualization tasks. The ggcoef_compare() function allows you to compare the coefficients of several models side by side, providing an intuitive way to
Yan Holtz (@r_graph_gallery) 's Twitter Profile Photo

🎁 New tutorial on the R Graph Gallery! A bump chart by Matthias Schnetzer The key to clarity in this #dataviz is highlighting a few key lines, preventing the chart from becoming too cluttered (aka spaghetti chart) ➡️ Full code and explanation: r-graph-gallery.com/web-bump-plot-…
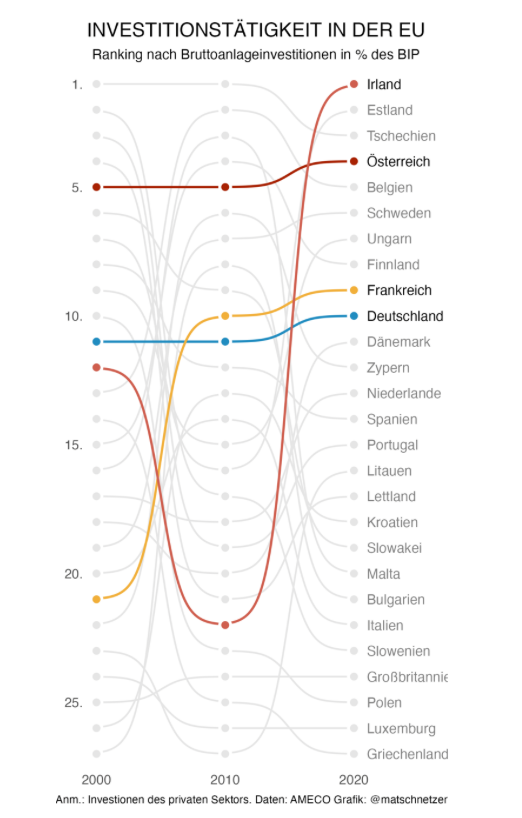
🎁 New tutorial on the R Graph Gallery!

A bump chart by <a href="/matschnetzer/">Matthias Schnetzer</a>

The key to clarity in this #dataviz is highlighting a few key lines, preventing the chart from becoming too cluttered (aka spaghetti chart)

➡️ Full code and explanation:
r-graph-gallery.com/web-bump-plot-…
R for Political Science (@stats_map) 's Twitter Profile Photo

Regional Economic Communities on the African Continent PART ONE: Scraping datasset with rvest in #rvest rforpoliticalscience.com/2023/08/21/how…

R for Political Science (@stats_map) 's Twitter Profile Photo

⭐How to scrape and graph #IrishElection results with #RStats from the web! 📊 Step-by-step how to find online data, clean it, and create semi-circle parliament graphs using ggparliament. 🎨 rforpoliticalscience.com/2025/01/21/how… #DataVisualization

Raphael Rashid (@koryodynasty) 's Twitter Profile Photo

President Yoon testified that he never ordered troops to drag out lawmakers from parliament. Now, his former defence minister Kim Yong-hyun claims there was a misunderstanding: Kim ordered troops to remove "agents" (요원-yowon) not "lawmakers" (의원-uiwon, similar sound).

President Yoon testified that he never ordered troops to drag out lawmakers from parliament.

Now, his former defence minister Kim Yong-hyun claims there was a misunderstanding: Kim ordered troops to remove "agents" (요원-yowon) not "lawmakers" (의원-uiwon, similar sound).
R for Political Science (@stats_map) 's Twitter Profile Photo

Examining women in the Irish Parliament PART 1: Scraping and cleaning data with the gender package. rforpoliticalscience.com/2025/01/31/how…

R for Political Science (@stats_map) 's Twitter Profile Photo

How to download and graph interactive country maps in #Rstats with the leaflet package rforpoliticalscience.com/2025/02/02/how… #map

じゅん (@x2dbupxukmtf4dc) 's Twitter Profile Photo

Kenneth Waltz's approach to reading classic political theory and why it matters | International Theory | Cambridge Core - bit.ly/3Vmz0ya

Yan Holtz (@r_graph_gallery) 's Twitter Profile Photo

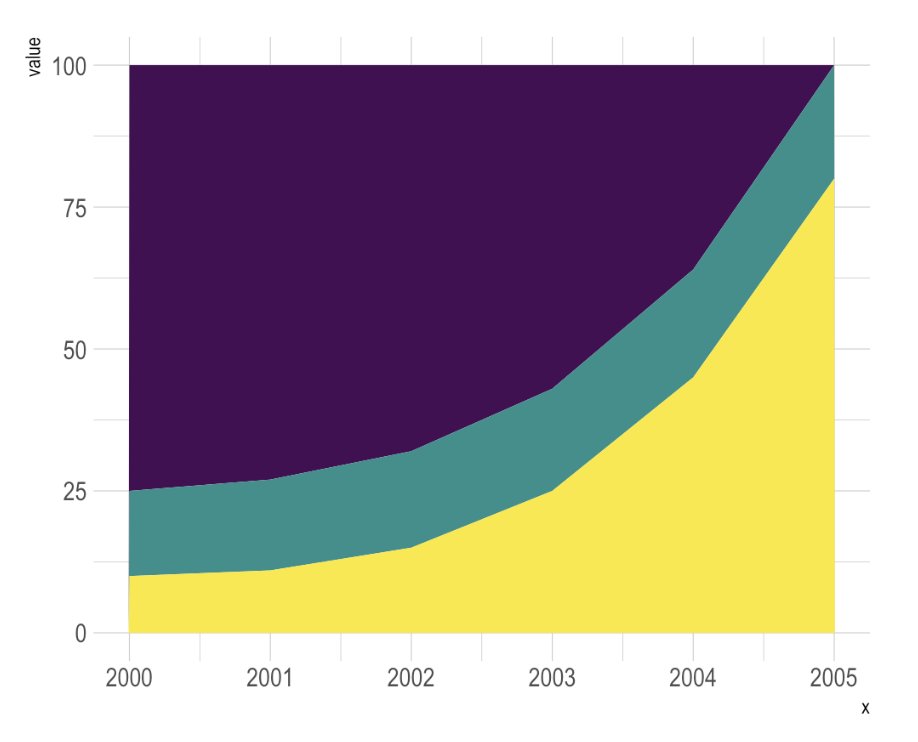
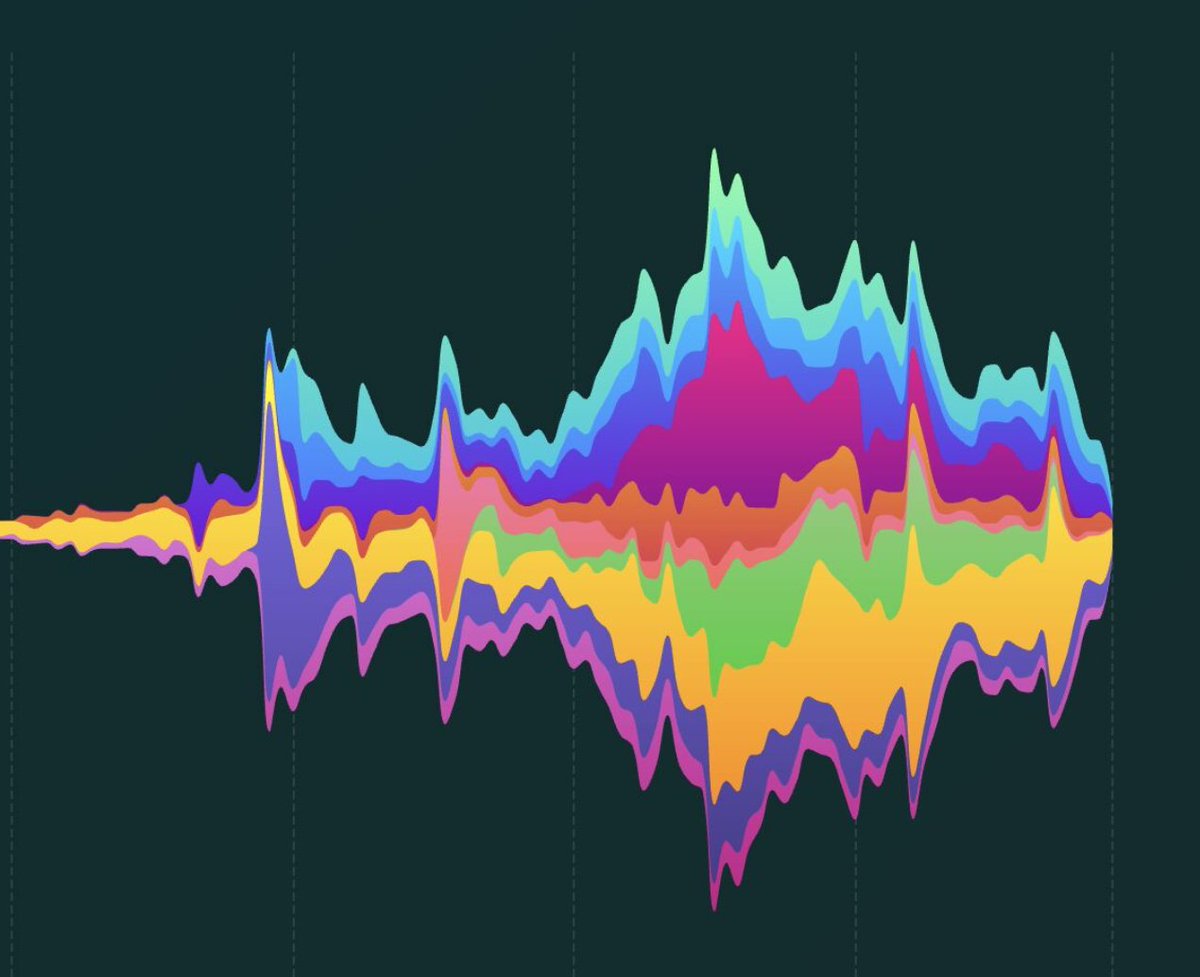
🍔 Stacking is dangerous in #dataviz. Is the green group increasing or decreasing? 🤔 It's so hard to tell (answer here shorturl.at/2hkno) Stacking is great if the main focus is on the whole. For single group evolution, use small multiple!

🍔 Stacking is dangerous in #dataviz.

Is the green group increasing or decreasing? 🤔

It's so hard to tell (answer here shorturl.at/2hkno)

Stacking is great if the main focus is on the whole. For single group evolution, use small multiple!
Yan Holtz (@r_graph_gallery) 's Twitter Profile Photo

😍 Just discovered the #dataviz work of Colas Droin He's a researcher transitioning to data visualization, and just released a very nice piece of scrollytelling: colasdroin.github.io/snsf-dataviz/ Bonus point: he used the react-graph-gallery.com to learn how to use d3.js in React 😇

😍 Just discovered the #dataviz work of Colas Droin

He's a researcher transitioning to data visualization, and just released a very nice piece of scrollytelling:
colasdroin.github.io/snsf-dataviz/

Bonus point: he used the react-graph-gallery.com to learn how to use d3.js  in React 😇
Joachim Schork (@joachimschork) 's Twitter Profile Photo

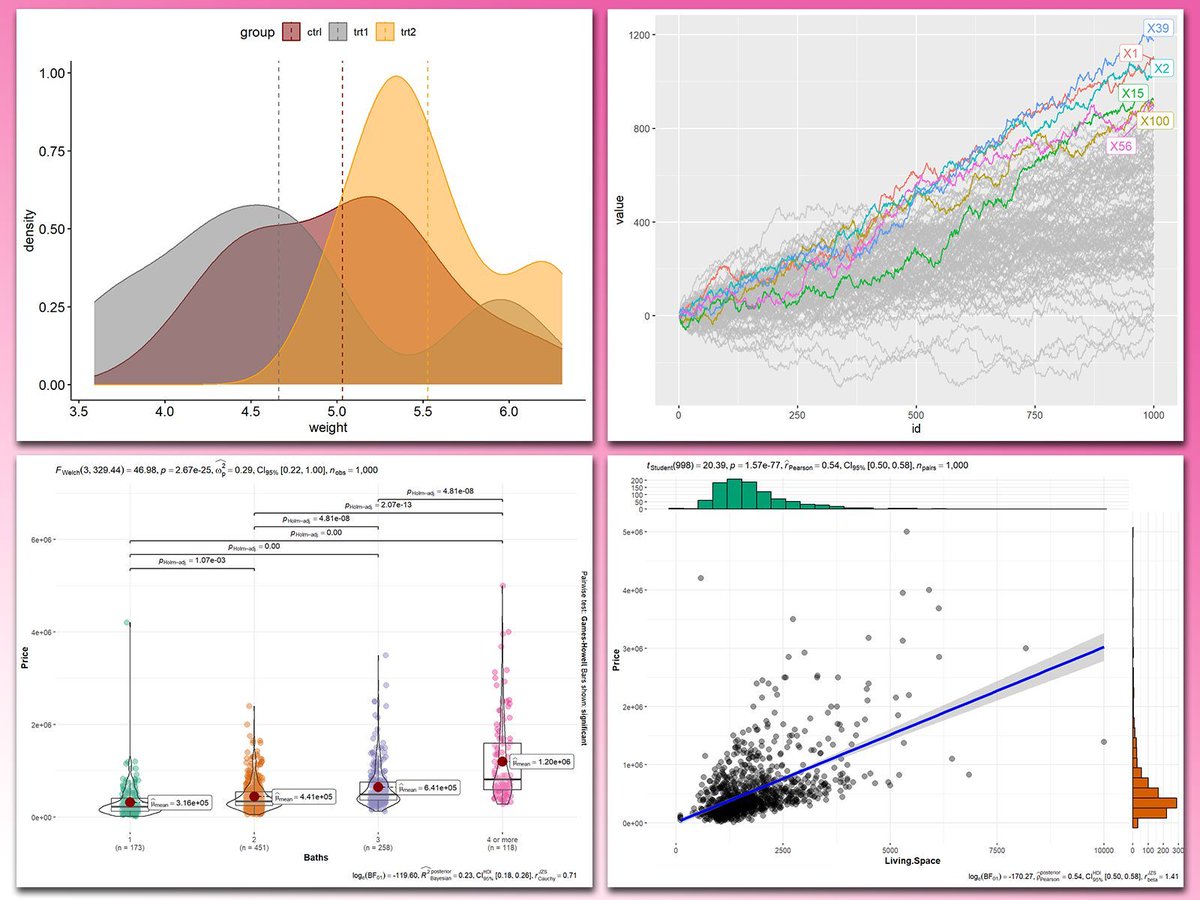
Adding statistical metrics to your plots can transform your visualizations from basic to highly informative. With ggplot2 in R and its versatile extensions, incorporating features like p-values, confidence intervals, and regression lines becomes both straightforward and visually

Adding statistical metrics to your plots can transform your visualizations from basic to highly informative. With ggplot2 in R and its versatile extensions, incorporating features like p-values, confidence intervals, and regression lines becomes both straightforward and visually
Yan Holtz (@r_graph_gallery) 's Twitter Profile Photo

It's now incredibly easy to build calendar heatmaps! Thanks Joseph for your dayplot library! Documentation: josephbarbierdarnal.github.io/dayplot/tuto/a… If you like making charts with Python, come learn with us at matplotlib-journey.com!

It's now incredibly easy to build calendar heatmaps!

Thanks <a href="/joseph_barbier/">Joseph</a> for your dayplot library!

Documentation:
josephbarbierdarnal.github.io/dayplot/tuto/a…

If you like making charts with Python, come learn with us at matplotlib-journey.com!
Joachim Schork (@joachimschork) 's Twitter Profile Photo

The ggalign package in R brings flexibility to your visualizations by helping align multiple plots and incorporate complex hierarchical data structures, like dendrograms, alongside your primary charts. This extension of ggplot2 makes it easier to organize heatmaps with clustering

The ggalign package in R brings flexibility to your visualizations by helping align multiple plots and incorporate complex hierarchical data structures, like dendrograms, alongside your primary charts. This extension of ggplot2 makes it easier to organize heatmaps with clustering
Joachim Schork (@joachimschork) 's Twitter Profile Photo

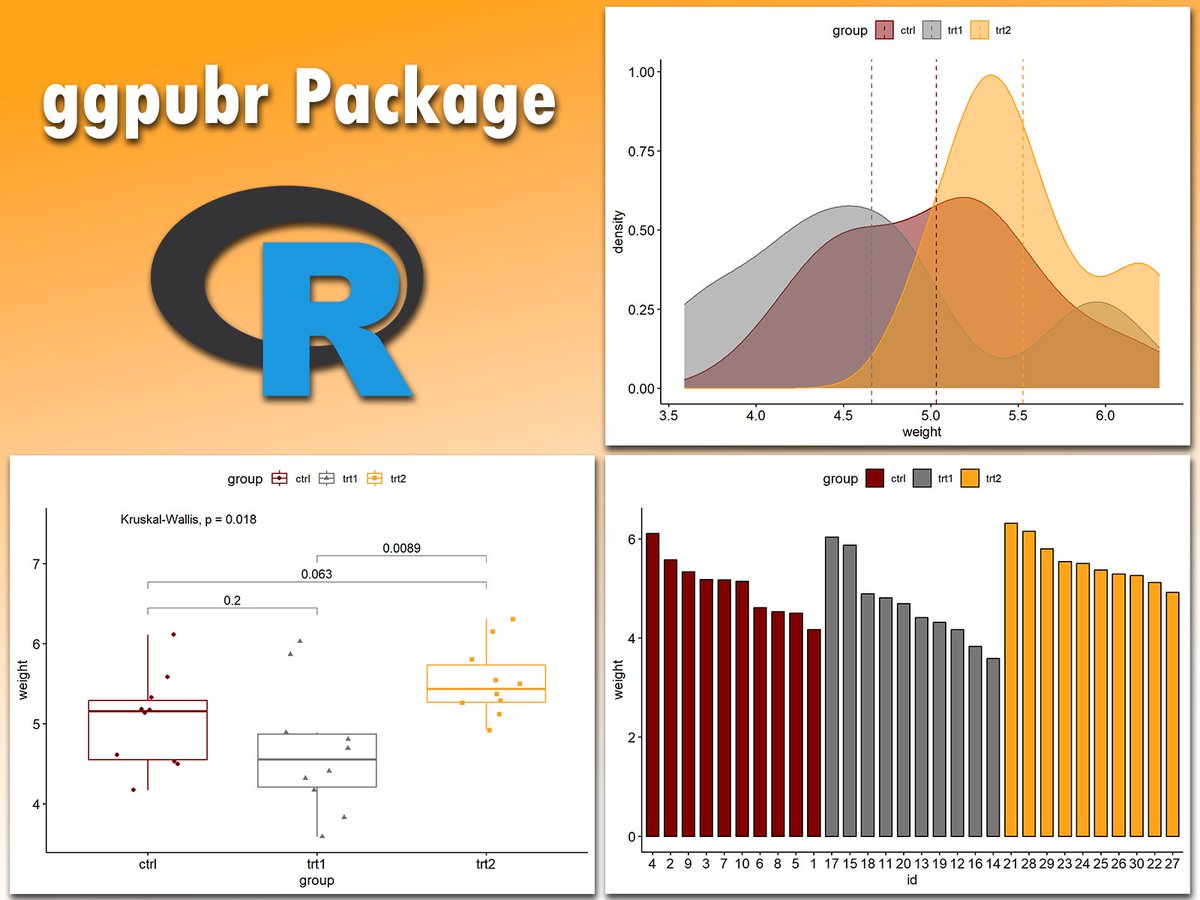
Creating publication-ready plots in R is easier than ever with ggpubr. This extension for ggplot2 simplifies the process of generating clean and professional graphics, especially for exploratory data analysis and reporting. The attached visual, which I created using ggpubr,

Creating publication-ready plots in R is easier than ever with ggpubr. This extension for ggplot2 simplifies the process of generating clean and professional graphics, especially for exploratory data analysis and reporting.

The attached visual, which I created using ggpubr,