Seamus Coffey (@seamuscoffey) 's Twitter Profile
Seamus Coffey

@seamuscoffey

Lecturer, @EconomicsUCC @CUBSucc @UCC.
Eisenhower Fellow, @EF_Fellows @IrishEF.

ID: 243781977

linkhttp://economic-incentives.blogspot.com/ calendar_today27-01-2011 20:11:21

15,15K Tweet

9,9K Takipçi

250 Takip Edilen

Seamus Coffey (@seamuscoffey) 's Twitter Profile Photo

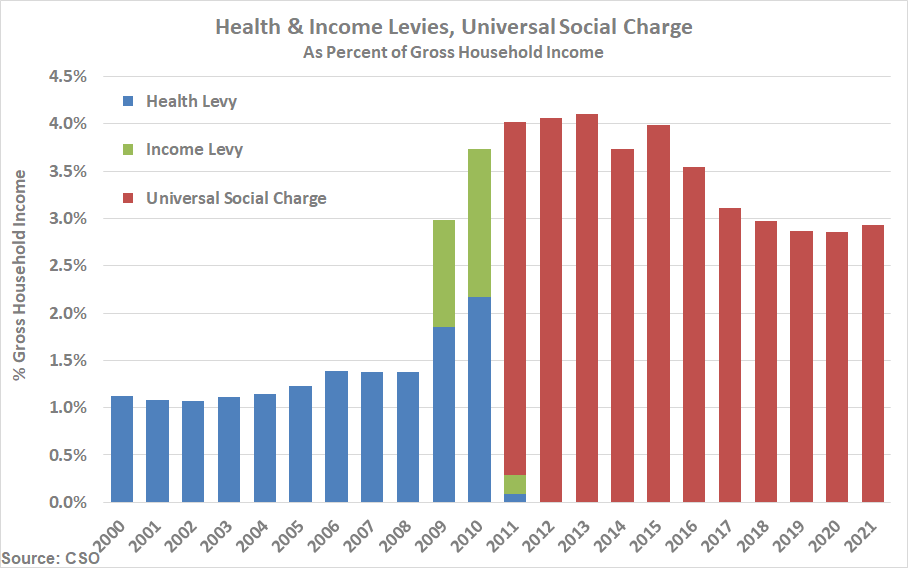
When the USC was brought in for 2011 it was neither new nor temporary. It replaced two existing taxes: the Health Levy, introduced in 1979 and increased in 2009, and the Income Levy, introduced in 2009. The USC was designed to initially match the revenue of the abolished levies.

When the USC was brought in for 2011 it was neither new nor temporary. It replaced two existing taxes: the Health Levy, introduced in 1979 and increased in 2009, and the Income Levy, introduced in 2009. The USC was designed to initially match the revenue of the abolished levies.
Seamus Coffey (@seamuscoffey) 's Twitter Profile Photo

Value added of 'Industry' is c.40% of Irish GDP. Dominated by foreign MNEs, output is volatile due to "contract manufacturing" done on their behalf (mainly outside IRE). In March "modern sector" output fell 48%, hence 'technical recession'; in Apr it rose 81%. Technical boom? No!

Value added of 'Industry' is c.40% of Irish GDP. Dominated by foreign MNEs, output is volatile due to "contract manufacturing" done on their behalf (mainly outside IRE). In March "modern sector" output fell 48%, hence 'technical recession'; in Apr it rose 81%. Technical boom? No!
Seamus Coffey (@seamuscoffey) 's Twitter Profile Photo

Consistent reductions in market income inequality has seen Ireland lose its outlier status among peer countries, e,g. the EU14 as shown below. From being clearly most unequal in five years to 2013, latest OECD estimates (for 2020) now rank Ireland as 7th highest across the EU14.

Consistent reductions in market income inequality has seen Ireland lose its outlier status among peer countries, e,g. the EU14 as shown below. From being clearly most unequal in five years to 2013, latest OECD estimates (for 2020) now rank Ireland as 7th highest across the EU14.
Seamus Coffey (@seamuscoffey) 's Twitter Profile Photo

The volume of purchases by first-time buyers has been relatively stable in the first few months of 2023. In the 12 months to April, Stamp Duty returns were filed for 16,800 FTB purchases, an average of c.325 per week. Around 70 percent of FTB purchases are for existing dwellings.

The volume of purchases by first-time buyers has been relatively stable in the first few months of 2023. In the 12 months to April, Stamp Duty returns were filed for 16,800 FTB purchases, an average of c.325 per week. Around 70 percent of FTB purchases are for existing dwellings.
Seamus Coffey (@seamuscoffey) 's Twitter Profile Photo

Recent IRS data show that Ireland was the third-largest recipient of corporate taxes from US MNCs in 2020, and the largest in the EU. For further discussion of their tax payments as well as some insights on substance (employees and tangible assets) see: economic-incentives.blogspot.com/2023/06/irelan…

Recent IRS data show that Ireland was the third-largest recipient of corporate taxes from US MNCs in 2020, and the largest in the EU. For further discussion of their tax payments as well as some insights on substance (employees and tangible assets) see: economic-incentives.blogspot.com/2023/06/irelan…
Seamus Coffey (@seamuscoffey) 's Twitter Profile Photo

Ireland had the 16th highest consumption per capita in the EU in 2022, lower than Cyprus, Lithuania, Slovenia & Romania. Ireland is put near the bottom for food, alcohol and, significantly, lowest for housing. Towards the top for hotels & restaurants (incl. pubs), and education.

Seamus Coffey (@seamuscoffey) 's Twitter Profile Photo

Prices in Ireland have generated some headlines this week. The data referred to may be a bit more nuanced than the headlines suggest. Ireland has some high prices. Though here are latest diesel prices, with & without taxes, for EU Member States published by European Commission.

Prices in Ireland have generated some headlines this week. The data referred to may be a bit more nuanced than the headlines suggest. Ireland has some high prices. Though here are latest diesel prices, with & without taxes, for EU Member States published by European Commission.
Seamus Coffey (@seamuscoffey) 's Twitter Profile Photo

On prices, inflation over the past decade in the consumer prices people actually pay has been lower in Ireland than the EU, notably for food, furnishings, transport & recreation. Exceptions are housing (rents & fuels) and education (private & third-level fees). Overall 7pp lower.

On prices, inflation over the past decade in the consumer prices people actually pay has been lower in Ireland than the EU, notably for food, furnishings, transport & recreation. Exceptions are housing (rents & fuels) and education (private & third-level fees). Overall 7pp lower.
Seamus Coffey (@seamuscoffey) 's Twitter Profile Photo

Since 1922 social housing output totalled c.400,000. Due to housing sold to tenants, current stock is less than half that (Norris & Hayden, 2018). Accounting for sales, 2 of the 3 fastest decades for 'net' additions have been the last 2 decades. 2020s decade likely to be highest.

Since 1922 social housing output totalled c.400,000. Due to housing sold to tenants, current stock is less than half that (Norris & Hayden, 2018). Accounting for sales, 2 of the 3 fastest decades for 'net' additions have been the last 2 decades. 2020s decade likely to be highest.
Seamus Coffey (@seamuscoffey) 's Twitter Profile Photo

Why suggest there is any confusion? A 'technical recession' based on GDP?? Been known since the early-90s that GDP isn't a useful indicator for the underlying performance of the Irish economy. Seems like an effort to make a story where there is none. Employment is +100k y-on-y.

Seamus Coffey (@seamuscoffey) 's Twitter Profile Photo

Today's Census housing results show the young are being squeezed out of housing. In 2011, those aged 20-34 were 23% of the population and 22% of households had a reference person aged under 35. By 2022, these were 18% and 14%; short 70,000 under 35 households to match 2011 level.

Today's Census housing results show the young are being squeezed out of housing. In 2011, those aged 20-34 were 23% of the population and 22% of households had a reference person aged under 35. By 2022, these were 18% and 14%; short 70,000 under 35 households to match 2011 level.