Ivelina Mirkova
@ivemirkova
PhD Researcher in the University of La Laguna
ID: 963727145834045440
14-02-2018 10:50:31
71 Tweet
15 Takipçi
66 Takip Edilen

#coal had a remarkable run of dominance in #Electricity generation in the US--about half of total generations for eight decades. Visualizing Energy visualizingenergy.org/watch-the-hist…


The Inflation Reduction Act is Investing in Nuclear. Should It? aeclinic.org/aec-blog/2023/… BU Institute for Global Sustainability Boston University, Earth & Environment @a_e_clinic Visualizing Energy


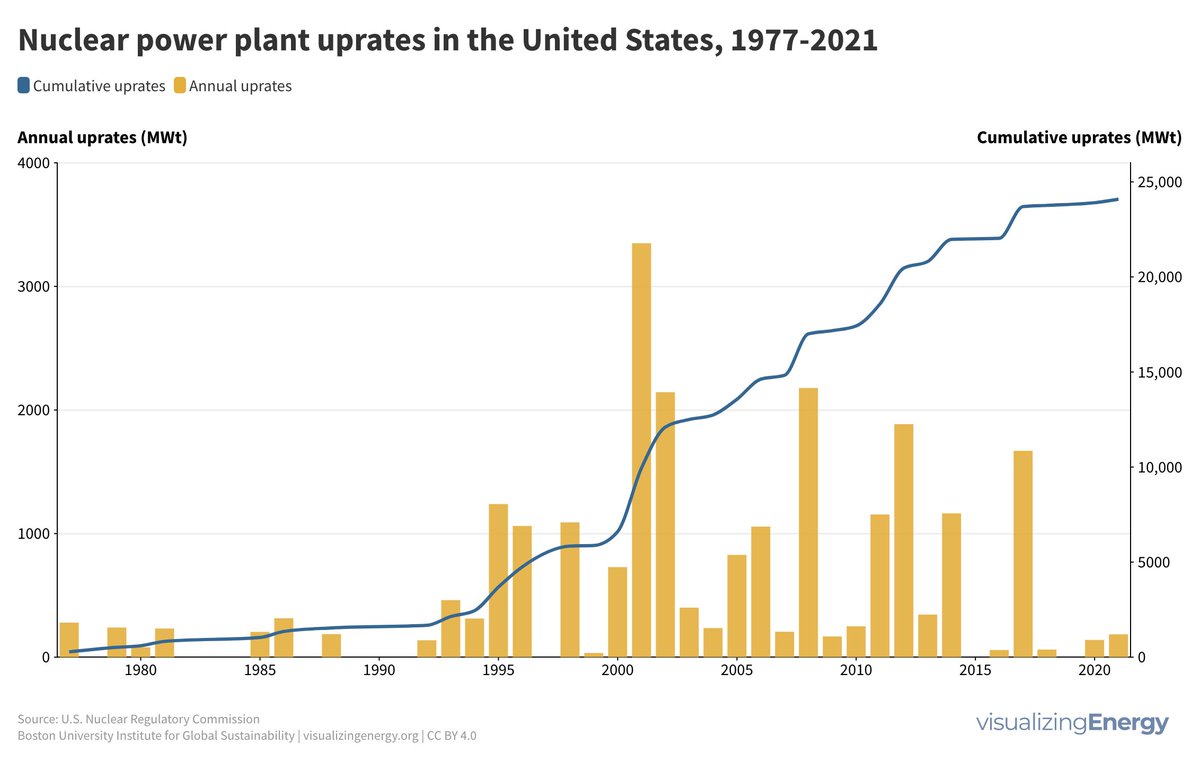
#NuclearPower has provided about 19% of US electricity since 1990 despite few new builds. One reason is impressive uprating of existing reactors. David Hess Good Energy Collective Adam Stein Will Davis Visualizing Energy visualizingenergy.org/what-is-nuclea…


Impressive how multiple #NuclearPower reactor units at the same site have gone through multiple rounds of uprating, e.g. Peach Bottom Titans of Nuclear World Nuclear Industry Status Report (WNISR) Hannah Ritchie World Nuclear News


US and China far and away dominate cumulative #coal production since 1900. Visualizing Energy visualizingenergy.org/the-history-of…


Lack of #CleanCooking has a distinct pattern-20 countries with the largest deficits account for 78% of the global population lacking access, including 10 countries in Sub-Saharan Africa. Clean Cooking Alliance (CCA) Global Energy Alliance for People and Planet Damilola Ogunbiyi spr.ly/6014XvFAM


🚗 Transportation accounts for 29% of #GreenhouseGas #emissions in the US & 20% globally. Use of #biofuels could reduce such emissions — but they're a contentious subject. More on why in this week's Visualizing Energy data story: spr.ly/6014ZQRdo U.S. EPA U.S. Department of Energy International Energy Agency

🌎 It's #EarthDay2024! Step into the IGS office & meet some of the BU Experts advancing research on topics including #OffshoreWind development, science communication, indoor air quality & more. Catch up on our latest research at spr.ly/6016bda8Q Boston University

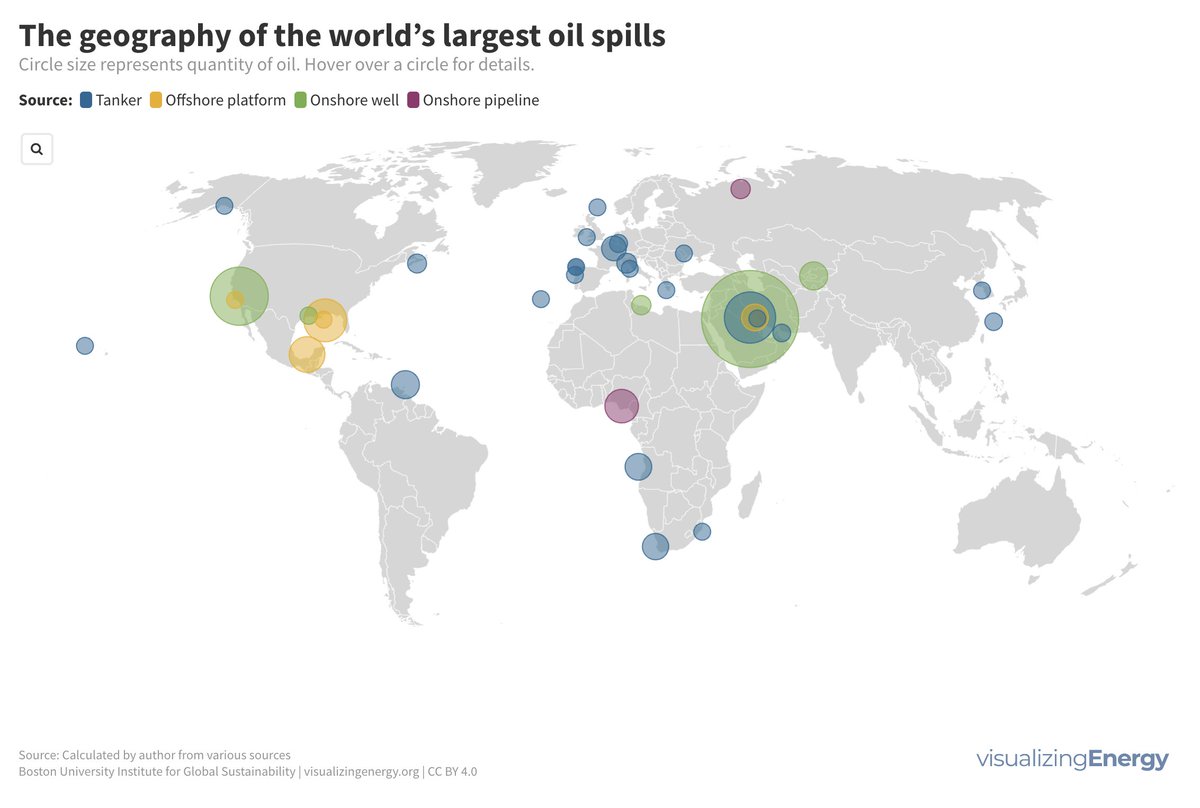
This month's newsletter for Visualizing Energy highlights data stories ranging from #oilspills to water use for electricity generation. Sign up for it here: visualizingenergy.org/newsletter/


Register now! At this free 7/16 Data Umbrella webinar, IGS's Cutler J. Cleveland of Boston University, Earth & Environment presents Visualizing Energy as an example of how #DataVisualization can help to enhance public understanding of #sustainable #energy. eventbrite.com/e/visualizing-…


#nuclearpower capacity additions accelerated in the 1970s and 1980s. New capacity declined after that due to the accidents at Three Mile Island and #Chernobyl, rising costs, public opposition, and cheaper renewables. Visualizing Energy visualizingenergy.org/global-nuclear…


