Matt Allington (@exceleratorbi) 's Twitter Profile
Matt Allington

@exceleratorbi

Matt Allington is a professional Power BI consultant, trainer and Microsoft MVP. Author of books that will teach you DAX. Expert in Power BI and Power Query.

ID: 3169230270

linkhttp://exceleratorbi.com.au calendar_today23-04-2015 22:33:45

1,1K Tweet

8,8K Takipçi

185 Takip Edilen

Matt Allington (@exceleratorbi) 's Twitter Profile Photo

The new card Visual in #PowerBI looks awesome. powerbi.microsoft.com/en-us/blog/new… We recently had Miguel speak at the Sydney PUG. If you want a sneak peak of what’s coming and how Miguel is making a difference, you can watch it here youtu.be/m4uLv9wWq7Y

Matt Allington (@exceleratorbi) 's Twitter Profile Photo

Not too many empty seats on a chilly winter’s evening at the Sydney #PowerBI user group, but that’s always going to happen when Marco Russo is in town. 👍

Not too many empty seats on a chilly winter’s evening at the Sydney #PowerBI user group, but that’s always going to happen when <a href="/marcorus/">Marco Russo</a> is in town. 👍
Roland Szirmai (@bilanalytics) 's Twitter Profile Photo

🏀 Shooting for the Stars - a Microsoft MVP! 👨‍💻 Who would've thought that my dreams of being an MVP would be realized in the tech world, not on the basketball court? 🤷‍♂️ #MVPBuzz #MicrosoftMVP #TechGameStrong #DreamBig #TechCommunity #PowerBI #DataPlatform #Analytics #Data

🏀 Shooting for the Stars - a Microsoft MVP! 👨‍💻

Who would've thought that my dreams of being an MVP would be realized in the tech world, not on the basketball court? 🤷‍♂️

#MVPBuzz #MicrosoftMVP #TechGameStrong #DreamBig #TechCommunity #PowerBI #DataPlatform #Analytics #Data
Matt Allington (@exceleratorbi) 's Twitter Profile Photo

oooohh, interesting. I just stumbled upon the fact that when using Analyze in Excel connected to a Power BI Online report, that you can now create implicit measures. It used to be that you could only use explicit measures. Was I the only one not knowing this?

oooohh, interesting.  I just stumbled upon the fact that when using Analyze in Excel connected to a Power BI Online report, that you can now create implicit measures. It used to be that you could only use explicit measures. Was I the only one not knowing this?
Matt Allington (@exceleratorbi) 's Twitter Profile Photo

David Ding is our guest speaker this week at the Sydney Power BI User Group. Another great turnout on another cold Sydney evening.

David Ding is our guest speaker this week at the Sydney Power BI User Group. Another great turnout on another cold Sydney evening.
Matt Allington (@exceleratorbi) 's Twitter Profile Photo

If you are in Sydney, then next week is a MUST ATTEND #PowerBI User Group. The Sydney PUG has the pleasure of having Darren Gosbell , Phil Seamark and Amanjeet Singh from #Microsoft presenting to us on the topic of Fabric. We would love to see you there meetup.com/sydney-power-b…

Matt Allington (@exceleratorbi) 's Twitter Profile Photo

About to hear Phil Seamark and Darren Gosbell from the Microsoft CAT team talk to the Sydney #PowerBI User Group about all things Fabric

About to hear Phil Seamark and Darren Gosbell from the Microsoft CAT team talk to the Sydney #PowerBI User Group about all things Fabric
Skillwave Training (@skillwave_) 's Twitter Profile Photo

Data professionals, it's time to level up! Stop the repetitive #datacleaning and start focusing on #dataanalysis. Learn how to save time and boost your career with #PowerQuery. 📈💼 Enroll now and enter code CYBERWEEK23 to save 23%: skw-t.com/cyberweek23-pqa #Excel #PowerBI

Matt Allington (@exceleratorbi) 's Twitter Profile Photo

Have you noticed that Microsoft recently announced the renaming of #PowerBI datasets and they're now called "semantic models"? Are you a bit confused by all of this, and/or want to learn more. I have written a short article explaining it all here bit.ly/46ljSms

Matt Allington (@exceleratorbi) 's Twitter Profile Photo

This chart was in The Australian newspaper today. 🙄. Seriously! In this case, the chart implies 2024 is half the 2021 number. A column chart encodes the value in the height of the column. Don’t be like The Australian; always set the axis to start at zero.
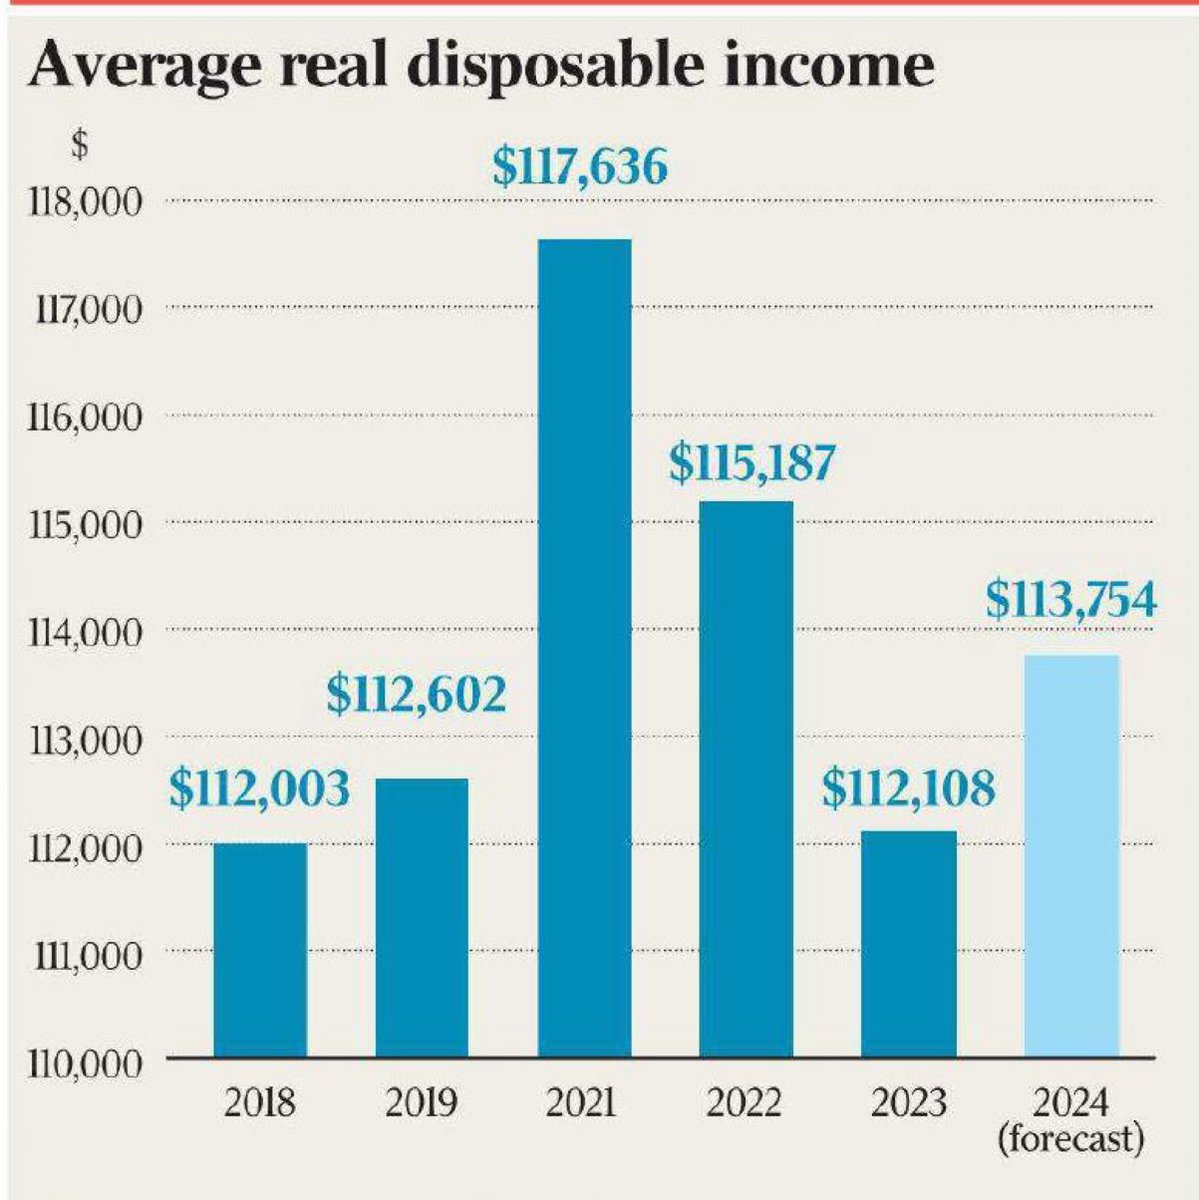
This chart was in <a href="/australian/">The Australian</a> newspaper today. 🙄. Seriously!  In this case, the chart implies 2024 is half the 2021 number. A column chart encodes the value in the height of the column. Don’t be like The Australian; always set the axis to start at zero.
Matt Allington (@exceleratorbi) 's Twitter Profile Photo

My journey as a #Microsoft #PowerBI MVP is coming to an end. It's be fun; thanks a lot Microsoft. Keep up the good work. Read about it here: exceleratorbi.com.au/my-journey-as-…

Matt Allington (@exceleratorbi) 's Twitter Profile Photo

Tonight Roland Szirmai is presenting to the Sydney Power BI User Group. If you haven’t seen Roland’s video channel on YouTube, you’re missing out big time. bilingualanalytics.com.au

Skillwave Training (@skillwave_) 's Twitter Profile Photo

We love hearing things like this from our students! 🤩 That's why we're committed to being the best learning resources for #BusinessIntelligence and #DataAnalytics, created by the best instructors in the business. 👩‍🎓 (Save 20% with code PBILOVE, go to skw-t.com/pbilove.)

We love hearing things like this from our students! 🤩
That's why we're committed to being the best learning resources for #BusinessIntelligence and #DataAnalytics, created by the best instructors in the business. 👩‍🎓

(Save 20% with code PBILOVE, go to skw-t.com/pbilove.)
Matt Allington (@exceleratorbi) 's Twitter Profile Photo

I’m looking forward to having Phil Seamark and patrick leblanc et al from the Power BI CAT team at the Sydney Power BI User Group tonight. Hope to see some Sydneysiders there. meetup.com/sydney-power-b…