Fakayode 📊📉
@de__techie
Data/BI Analyst | I unlock insights hidden in several rows of data | 1X #VOTD | 2X Tableau & Microsoft Certified - Tableau, SQL, Power BI, Excel, Python
ID: 1823523746931695616
https://engfakayode.github.io/ 14-08-2024 00:55:41
149 Tweet
48 Takipçi
18 Takip Edilen

Huge thank you to our amazing speakers Tobi Williams , DataVizAbby , seBASHtine & Olushola Olojo, and Fakayode 📊📉 , 🧚🏿♀️ & Jennifer Eneh for sharing their journeys. You made the day unforgettable! 🙌


Hello 👋🏽 #DataFam, Excited to share another collaboration with the amazing Ella Tudome — we built this Data Visualization Guide for the community! 🔗 : lnkd.in/dXStDkAw What this guide offers: 🌟 22 chart types 🌟 9 visualization categories 🌟 Light & dark modes

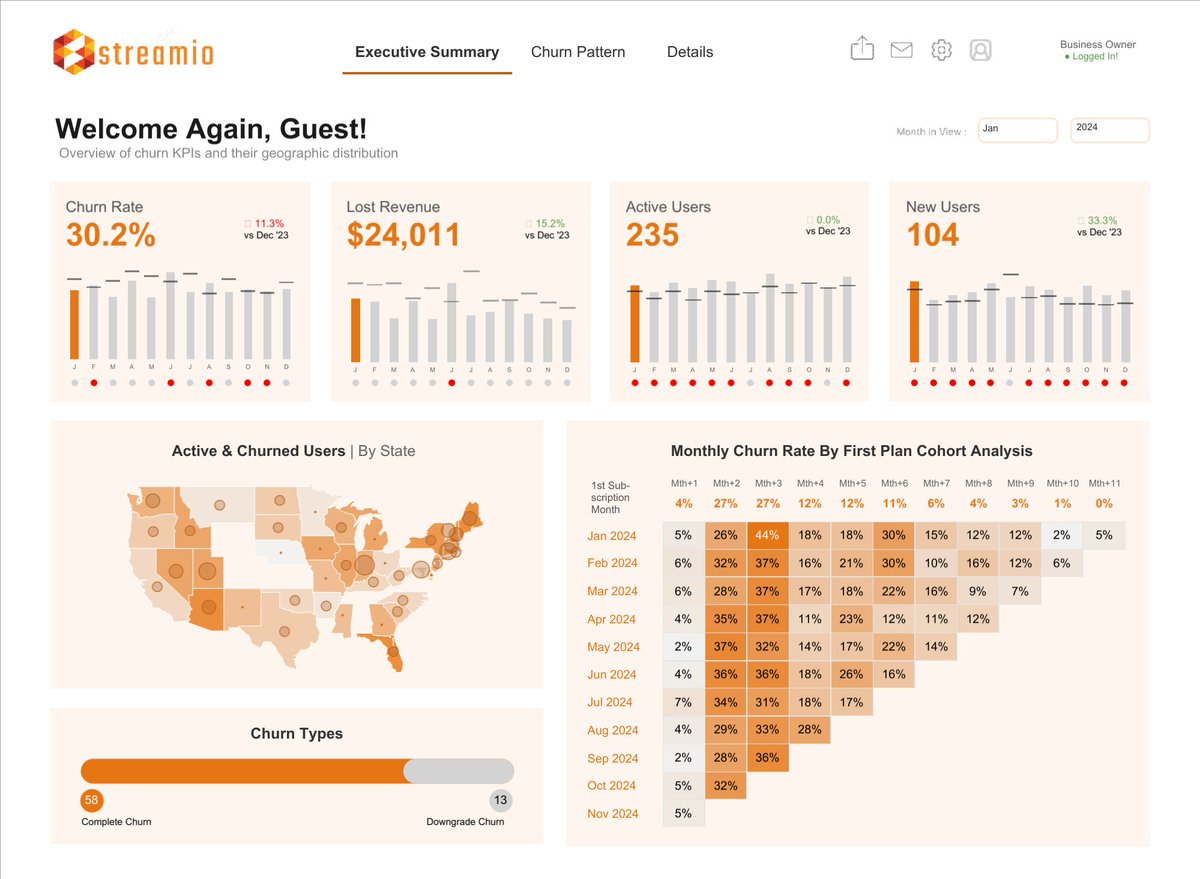
In this #VizOfTheDay, Fakayode 📊📉 visualizes Music Streaming Churn. The dashboard provides a comprehensive look into subscriber behavior and churn patterns, helping to identify at-risk users and optimize retention. Explore the viz: tabsoft.co/46bmsNA


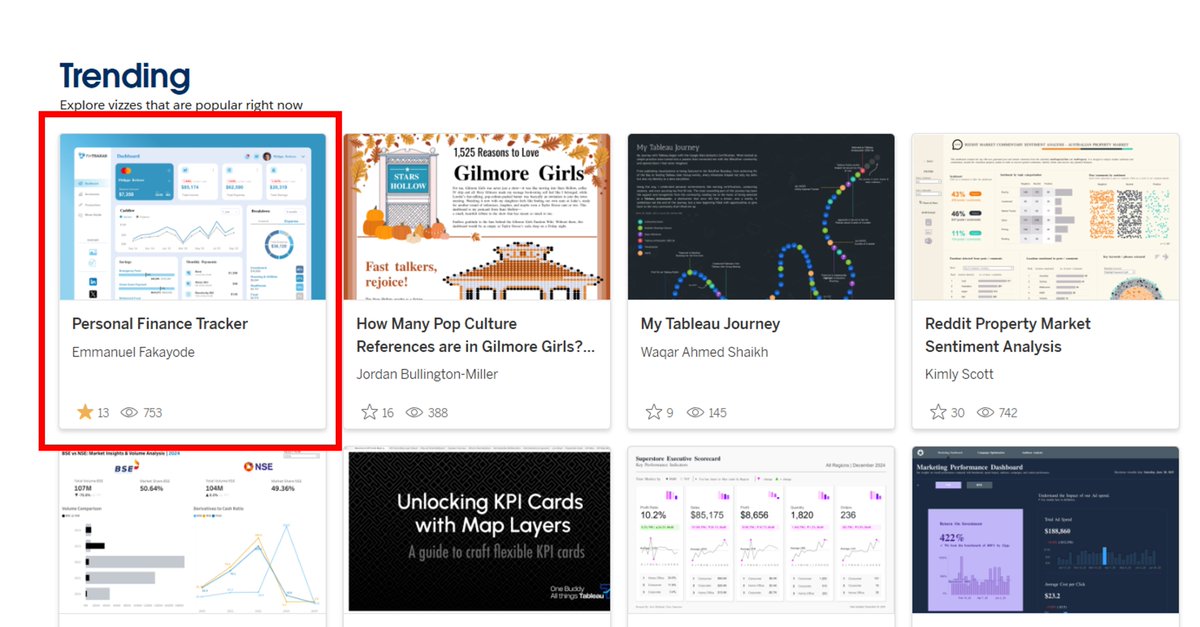
Am glad to receive my 2nd #VizOfTheDay #VOTD nomination Thanks you Tableau Public This highlights the impact of my visualization which specifically addresses customer churn in the music streaming industry through data-driven insights. Explore here: public.tableau.com/app/profile/fa…


