Helly Robertson (@hfrobertson11) 's Twitter Profile
Helly Robertson

@hfrobertson11

Software Engineer @f_l_o_u_r_i_s_h | previously @GuardianVisuals @FTdata | @compjcdf @UCLQStep

ID: 2885093867

calendar_today20-11-2014 01:09:49

112 Tweet

328 Followers

1,1K Following

Flourish (@f_l_o_u_r_i_s_h) 's Twitter Profile Photo

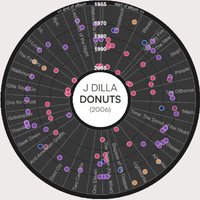
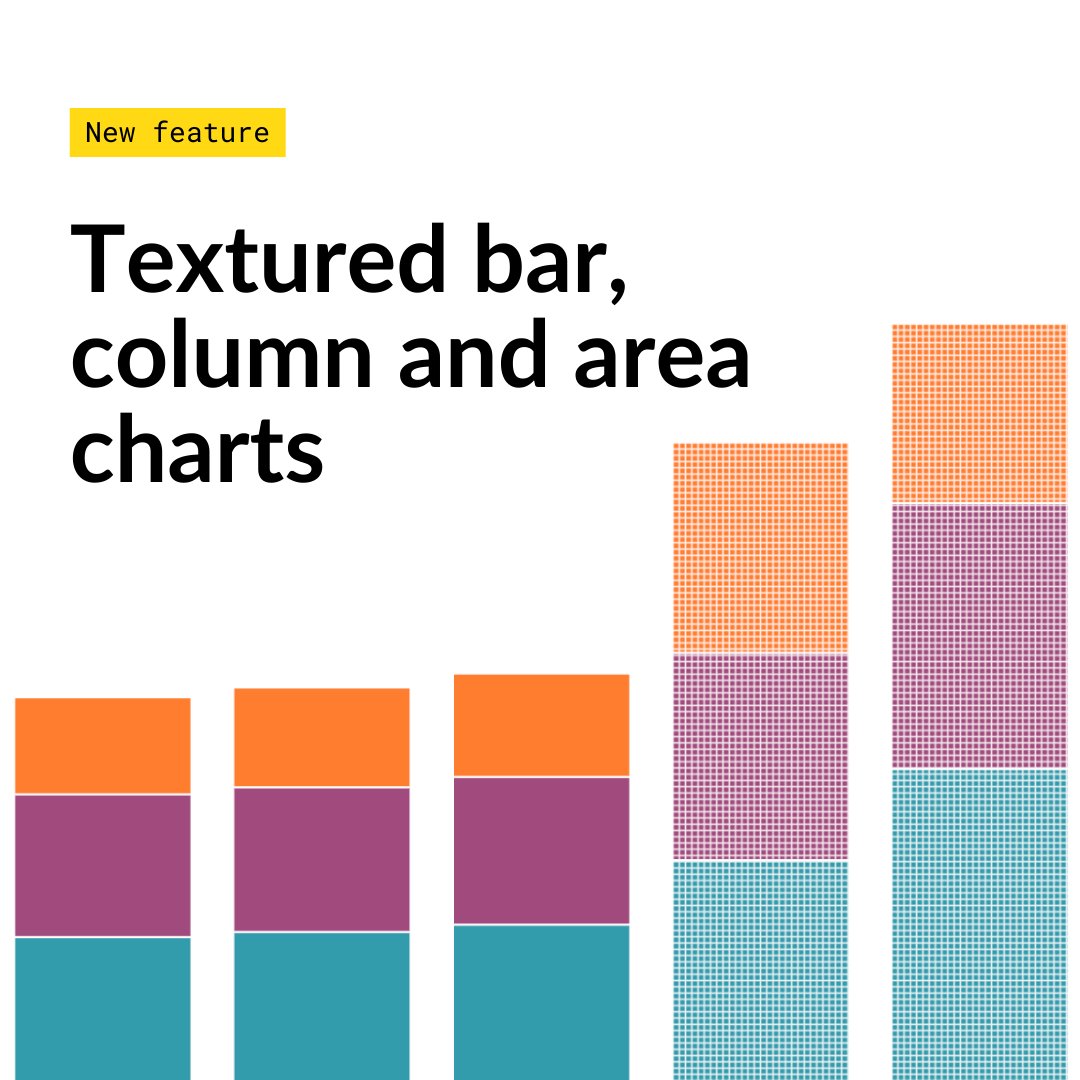
🚨 New feature alert! 🚨 You can now add texture to your column, bars and area charts! This is a great way of differentiating between or highlighting groups in your visualizations. 👉Click here to find out how to create your own! help.flourish.studio/article/419-ho…

🚨 New feature alert! 🚨

You can now add texture to your column, bars and area charts! This is a great way of differentiating between or highlighting groups in your visualizations. 

👉Click here to find out how to create your own! 
help.flourish.studio/article/419-ho…
Owen Comstock (@comstockery) 's Twitter Profile Photo

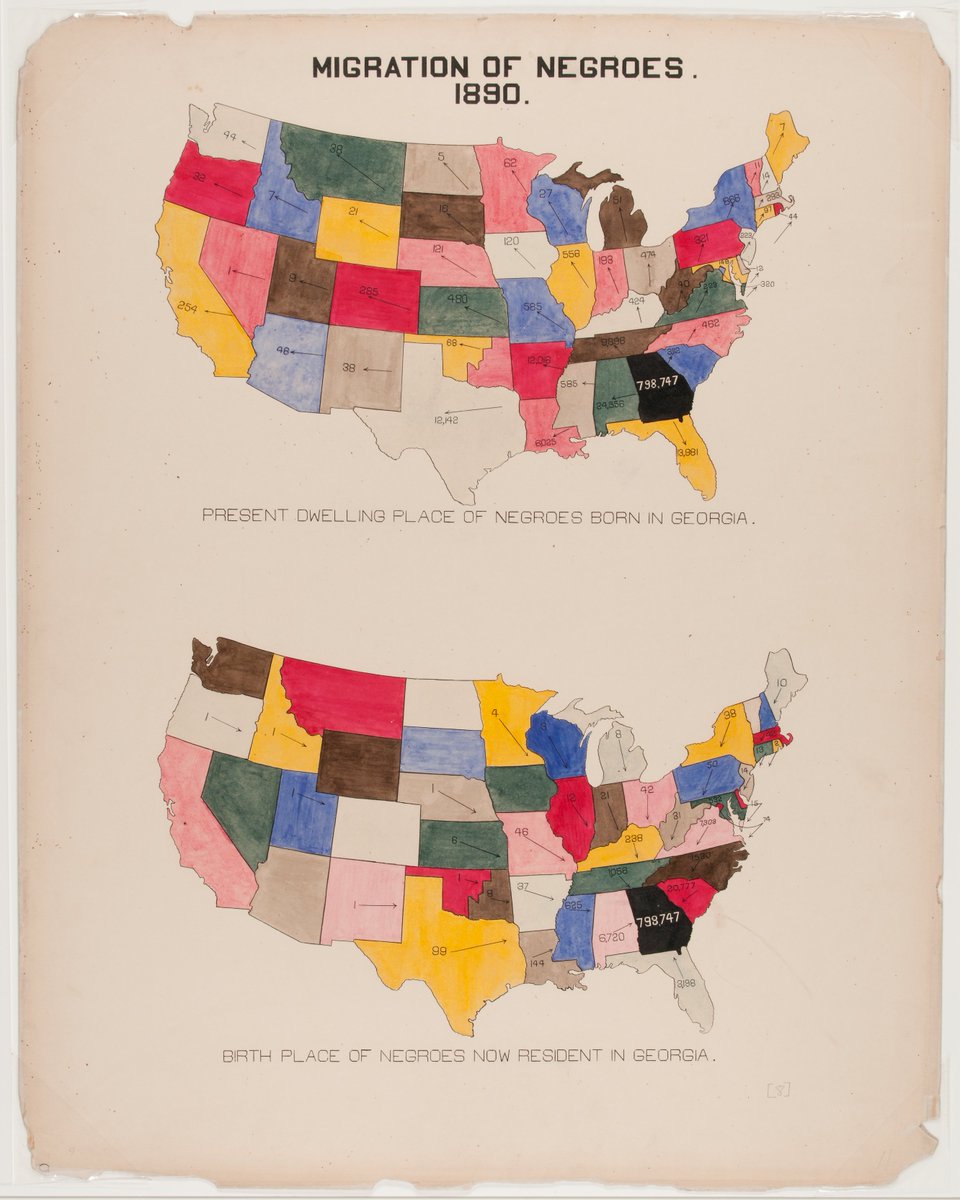
One of my first projects for graduate school involved revisiting a pre-1900 data visualization. I picked a set of WEB Du Bois maps and ended up going down a few rabbit holes...

One of my first projects for graduate school involved revisiting a pre-1900 data visualization. I picked a set of WEB Du Bois maps and ended up going down a few rabbit holes...
John Burn-Murdoch (@jburnmurdoch) 's Twitter Profile Photo

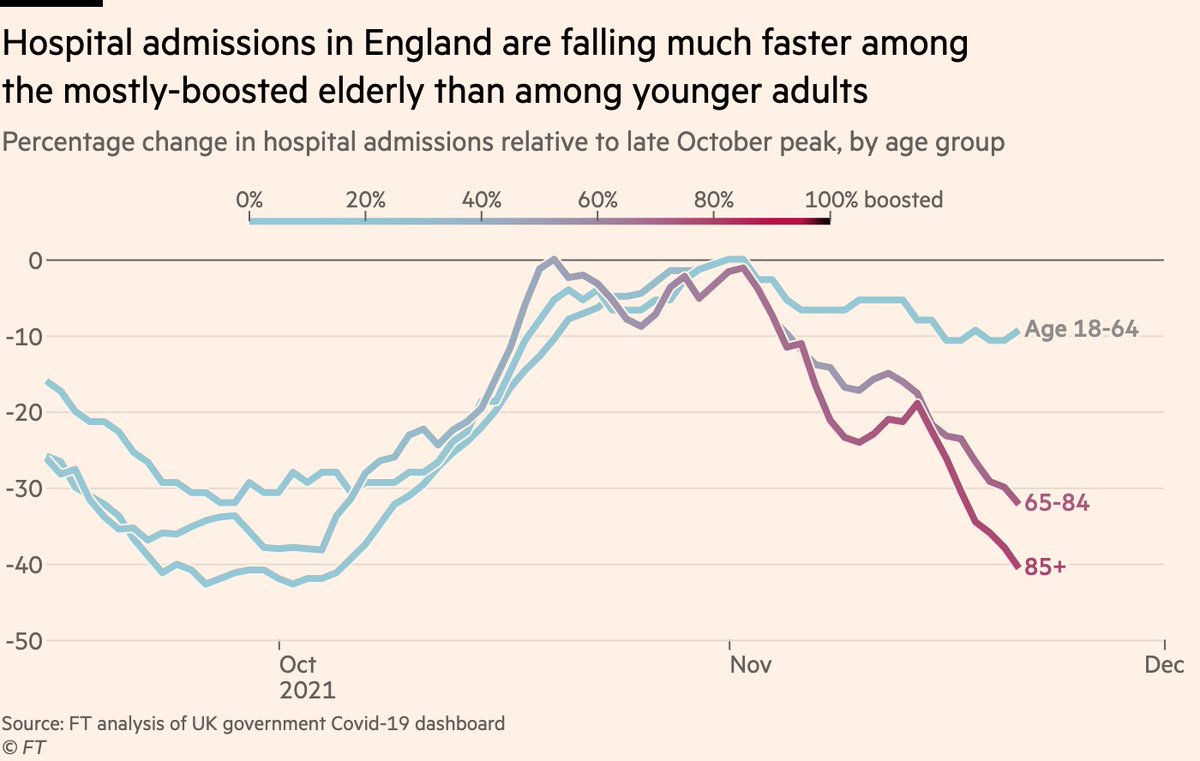
And if you thought that was impressive, take a look at the same thing for hospital admissions: Admissions in England have been relatively stable among people aged 18-64 in England over recent weeks, but they’re falling precipitously in the mostly-boosted over-65s 💉🏥📉

And if you thought that was impressive, take a look at the same thing for hospital admissions:

Admissions in England have been relatively stable among people aged 18-64 in England over recent weeks, but they’re falling precipitously in the mostly-boosted over-65s 💉🏥📉
Flourish (@f_l_o_u_r_i_s_h) 's Twitter Profile Photo

Imagine a chart without a title, no labels, and no visual clues to what it is about – how much would you be able to understand? 📝 Without a doubt, text is one of the most crucial elements of data visualization.

Imagine a chart without a title, no labels, and no visual clues to what it is about – how much would you be able to understand? 📝 

Without a doubt, text is one of the most crucial elements of data visualization.
Krisztina Szűcs (@szucsi) 's Twitter Profile Photo

This is how a handball match result looks like. Very different from the soccer matches I posted during the summer. Looks way more intense too. 😄 plotparade.com/gallery_UEFA.h… #SheLovesHandball #dataviz #d3js

Sam Joiner (@samjoiner) 's Twitter Profile Photo

The rise of omicron has thrust LFTs back into the spotlight, with thousands of us using them to go about our daily lives. Hannah Kuchler explains why they’re still such a vital part of the government’s £37bn testing programme - and reminds us their effectiveness remains limited

The rise of omicron has thrust LFTs back into the spotlight, with thousands of us using them to go about our daily lives. 

<a href="/hannahkuchler/">Hannah Kuchler</a> explains why they’re still such a vital part of the government’s £37bn testing programme - and reminds us their effectiveness remains limited
Andy Kriebel (@vizwizbi) 's Twitter Profile Photo

#TableauTip: How to Create a Calendar Widget for Filtering vizwiz.com/2022/01/calend… Why have a regular calendar filter when you can have one that adds information to your dashoboard?

Helly Robertson (@hfrobertson11) 's Twitter Profile Photo

If you want to experience what data journalism is like from the inside of some of the best teams in Europe, this is the way to do it 👇can’t recommend highly enough

Flourish (@f_l_o_u_r_i_s_h) 's Twitter Profile Photo

(1/8) Who knew five letter words could be so exciting! 🟩🟨⬛️ Inspired by the viral success of Wordle, here at Flourish we wanted to dive deeper into the craze surrounding the puzzle.

(1/8) Who knew five letter words could be so exciting! 🟩🟨⬛️

Inspired by the viral success of Wordle, here at Flourish we wanted to dive deeper into the craze surrounding the puzzle.
Guardian Visuals (@guardianvisuals) 's Twitter Profile Photo

If you're a student or recent graduate with a passion for visual journalism, this is a great opportunity to do a paid internship with our team!

Flourish (@f_l_o_u_r_i_s_h) 's Twitter Profile Photo

🚨 New feature alert! 🚨 Now you can display region labels on projection maps 🗺 Highly requested by our users, you can now choose which labels to show or hide and customize their appearance! Learn how this new feature works here: help.flourish.studio/article/489-ho…

Flourish (@f_l_o_u_r_i_s_h) 's Twitter Profile Photo

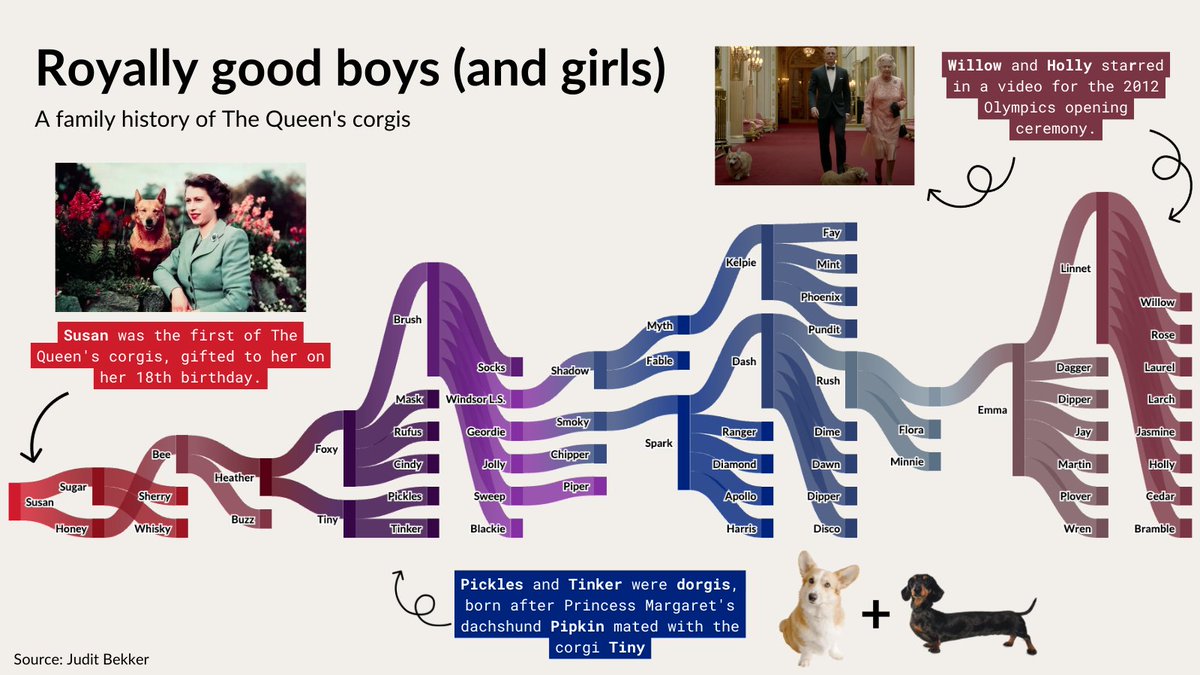
Happy Jubilee weekend! 🇬🇧🫖👑 Lots has changed in the years since Queen Elizabeth II was crowned, but one thing that has remained is Her Royal Highness’ love of corgis. In the Sankey chart below we dive into the family tree of The Queen’s beloved pets – all starting with Susan.

Happy Jubilee weekend! 🇬🇧🫖👑

Lots has changed in the years since Queen Elizabeth II was crowned, but one thing that has remained is Her Royal Highness’ love of corgis. In the Sankey chart below we dive into the family tree of The Queen’s beloved pets – all starting with Susan.
Flourish (@f_l_o_u_r_i_s_h) 's Twitter Profile Photo

We are excited to announce that Canva & Flourish will be partnering with Data Visualization Society for their #IIBAwards this year. We can’t wait to celebrate the excellence & beauty of data visualization with so many people! 👉 find out more here: bit.ly/3XqRkov

We are excited to announce that <a href="/Canva/">Canva</a> &amp; Flourish will be partnering with <a href="/DataVizSociety/">Data Visualization Society</a> for their #IIBAwards this year.
 
We can’t wait to celebrate the excellence &amp; beauty of data visualization with so many people!
 
👉 find out more here: bit.ly/3XqRkov
Flourish (@f_l_o_u_r_i_s_h) 's Twitter Profile Photo

As avid readers, we wanted to find a way to combine our love of books with our passion for data viz. We set out to read a variety of books throughout the year and then create visualizations that captured the essence of each book. Read the thread to see our visualizations! (1/8)

As avid readers, we wanted to find a way to combine our love of books with our passion for data viz. We set out to read a variety of books throughout the year and then create visualizations that captured the essence of each book. Read the thread to see our visualizations! (1/8)
Flourish (@f_l_o_u_r_i_s_h) 's Twitter Profile Photo

As a submission for Data Visualization Society’s competition, we analyzed colors used across Bob Ross’ works to create beautiful visualizations. From Titanium White to Alizarin Crimson, we’ve discovered the hues that brought his art to life. 👉 Read the blog here: flourish.studio/blog/bob-ross-…

As a submission for <a href="/DataVizSociety/">Data Visualization Society</a>’s competition, we analyzed colors used across Bob Ross’ works to create beautiful visualizations. 

From Titanium White to Alizarin Crimson, we’ve discovered the hues that brought his art to life.

👉 Read the blog here: flourish.studio/blog/bob-ross-…
Flourish (@f_l_o_u_r_i_s_h) 's Twitter Profile Photo

Spice up your designs with a sprinkle of #DataVisualization! 📈✨ Did you know that you can use the Flourish app directly within Canva? Say goodbye to boring charts and hello to eye-catching data stories! 🙌 👉 Click here to get started: canva.com/your-apps/AAEv…