Fernando Vidal (@fernavid) 's Twitter Profile
Fernando Vidal

@fernavid

Cofounder and Chief Data Scientist at @3F_Research building the next generation of investment research. Mainly trying to post cool charts. PM $FCTE $RAA

ID: 985606748

linkhttps://3fourteenresearch.com calendar_today02-12-2012 23:58:18

852 Tweet

3,3K Followers

599 Following

The Compound (@thecompoundnews) 's Twitter Profile Photo

Strength Leads to Strength | TCAF 162🎙️ Downtown Josh Brown and Michael Batnick are joined by Warren Pies and Fernando Vidal of 3Fourteen Research to discuss the perfect backdrop for gold, when to fade strategist price targets, overall market valuations, the bifurcated economy, and more!🔥

Strength Leads to Strength | TCAF 162🎙️

<a href="/Downtown/">Downtown Josh Brown</a> and <a href="/michaelbatnick/">Michael Batnick</a> are joined by <a href="/WarrenPies/">Warren Pies</a> and <a href="/fernavid/">Fernando Vidal</a> of <a href="/3F_Research/">3Fourteen Research</a> to discuss the perfect backdrop for gold, when to fade strategist price targets, overall market valuations, the bifurcated economy, and more!🔥
Fernando Vidal (@fernavid) 's Twitter Profile Photo

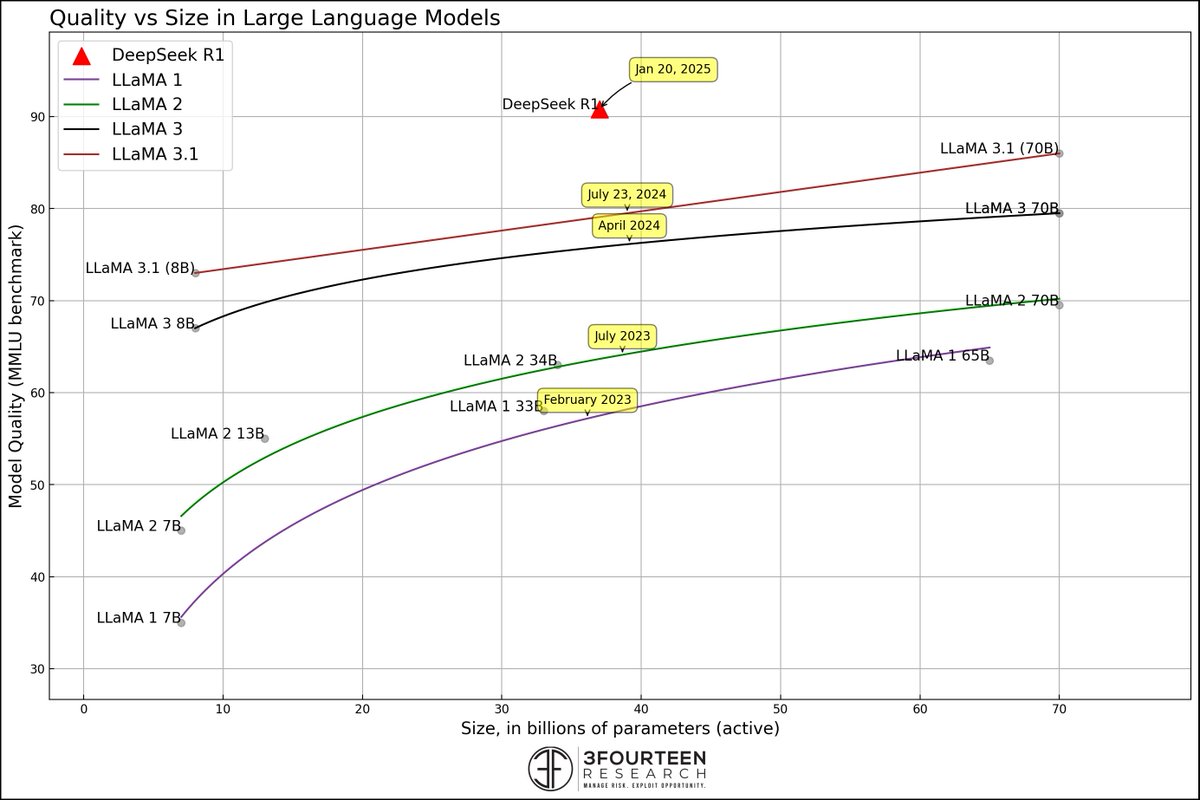
Adding DeepSeek R1 to our chart showing AI efficiency gains over time. Y axis ~= performance, X axis ~= cost to run. Each research step forward lets us do more with less. The future of GPU demand remains a question of whether adoption or efficiency increases faster.

Adding DeepSeek R1 to our chart showing AI efficiency gains over time. Y axis ~= performance, X axis ~= cost to run. Each research step forward lets us do more with less. The future of GPU demand remains a question of whether adoption or efficiency increases faster.
Fernando Vidal (@fernavid) 's Twitter Profile Photo

Curious to see if it becomes harder to rent a cluster now that anyone can grab one and run their own private copy of DeepSeek on it.

Fernando Vidal (@fernavid) 's Twitter Profile Photo

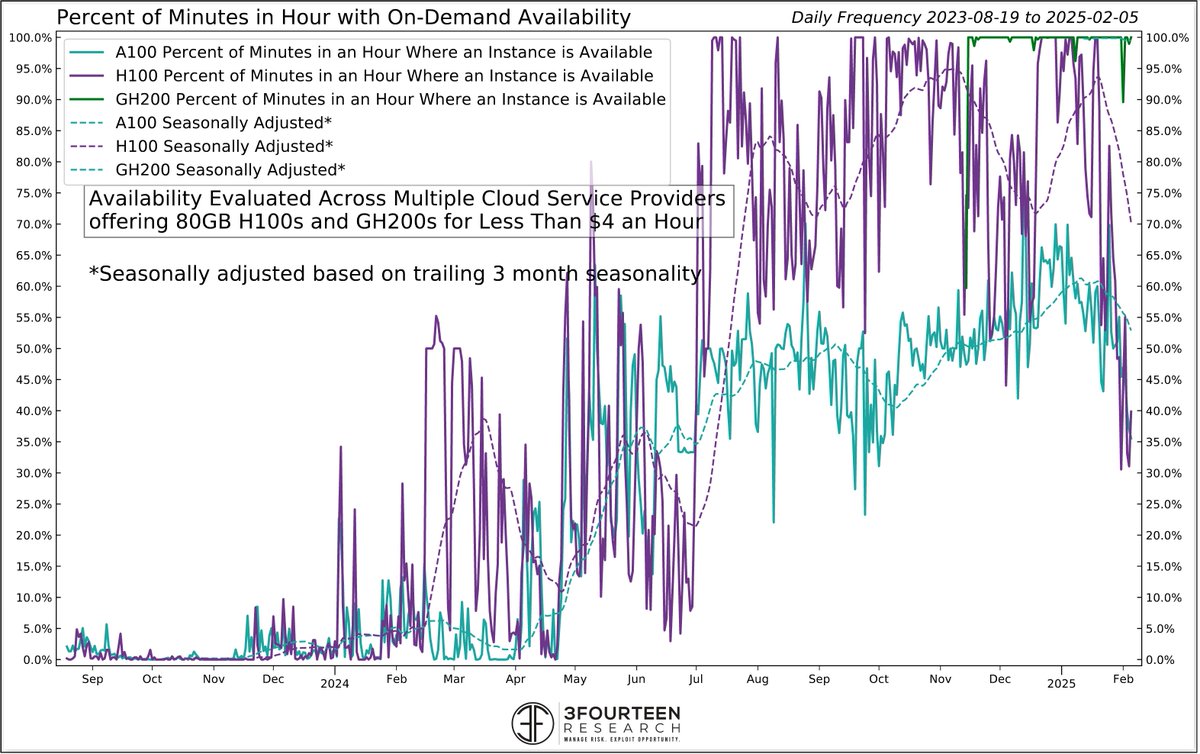
DeepSeek's R1 has made it WAY harder to rent a cheap Nvidia H100 GPU. Hasn't been this hard to get a cheap H100 since early 2024. Curious how much open-source model usage is cannibalizing OpenAI/Anthropic's utilization vs growing the pie though.

DeepSeek's R1 has made it WAY harder to rent a cheap Nvidia H100 GPU. Hasn't been this hard to get a cheap H100 since early 2024. 

Curious how much open-source model usage is cannibalizing OpenAI/Anthropic's utilization vs growing the pie though.
Fernando Vidal (@fernavid) 's Twitter Profile Photo

From a recent o3-mini chain of thought summary: "I'm showcasing the last flourishing self-confidence moment before a motivational dip in self-esteem, revealing a more nuanced and mature approach to the concept."

Fernando Vidal (@fernavid) 's Twitter Profile Photo

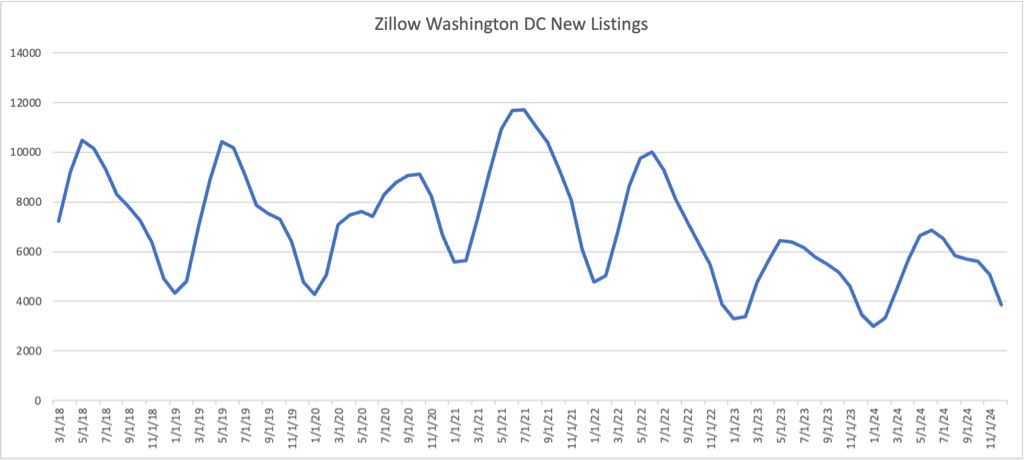
Seeing so many posts about Washington DC home listings EXPLODING but there is no context for how it differs from any random day in the past. Zillow new listing data as of December shows nothing interesting happening in DC, maybe the January update will show something...

Seeing so many posts about Washington DC home listings EXPLODING but there is no context for how it differs from any random day in the past. Zillow new listing data as of December shows nothing interesting happening in DC, maybe the January update will show something...
Fernando Vidal (@fernavid) 's Twitter Profile Photo

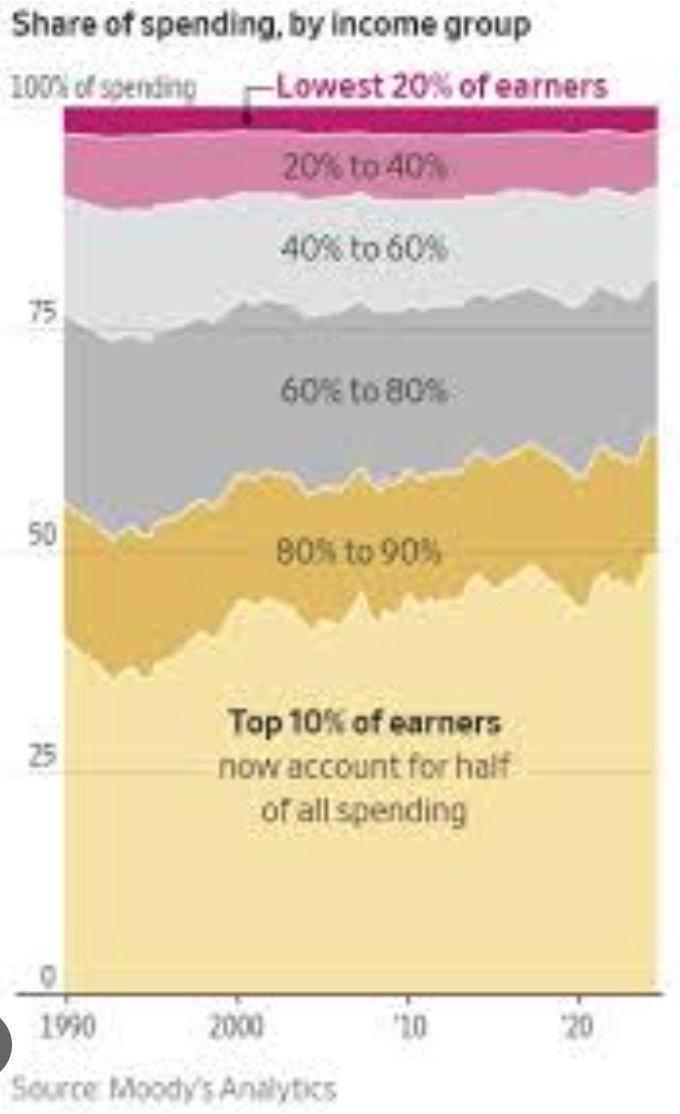
I've been seeing this chart on % of consumer spending from the top 10% by income reaching 50%. Anyone know how they came up with this number? BLS Consumer Expenditure Survey suggests it's far less, with the top 20% being less than 40% (and top 10% being around 23%).

I've been seeing this chart on % of consumer spending from the top 10% by income reaching 50%. Anyone know how they came up with this number? BLS Consumer Expenditure Survey suggests it's far less, with the top 20% being less than 40% (and top 10% being around 23%).
The Compound (@thecompoundnews) 's Twitter Profile Photo

End of an Empire | TCAF 188 Downtown Josh Brown and Michael Batnick are joined by Warren Pies of 3Fourteen Research to discuss what earnings typically look like after stock market corrections, Trump's next trade war moves, money leaving the USA, recession indicators, and more!🔥

End of an Empire | TCAF 188

<a href="/Downtown/">Downtown Josh Brown</a> and <a href="/michaelbatnick/">Michael Batnick</a> are joined by <a href="/WarrenPies/">Warren Pies</a> of <a href="/3F_Research/">3Fourteen Research</a> to discuss what earnings typically look like after stock market corrections, Trump's next trade war moves, money leaving the USA, recession indicators, and more!🔥
Fernando Vidal (@fernavid) 's Twitter Profile Photo

A quick demo of the chart catalog feature on the 3Fourteen Research client site. Along with archives of every report we have ever written, every chart we have ever featured in our research is searchable and available with a link back to the report it was originally featured in on

Fernando Vidal (@fernavid) 's Twitter Profile Photo

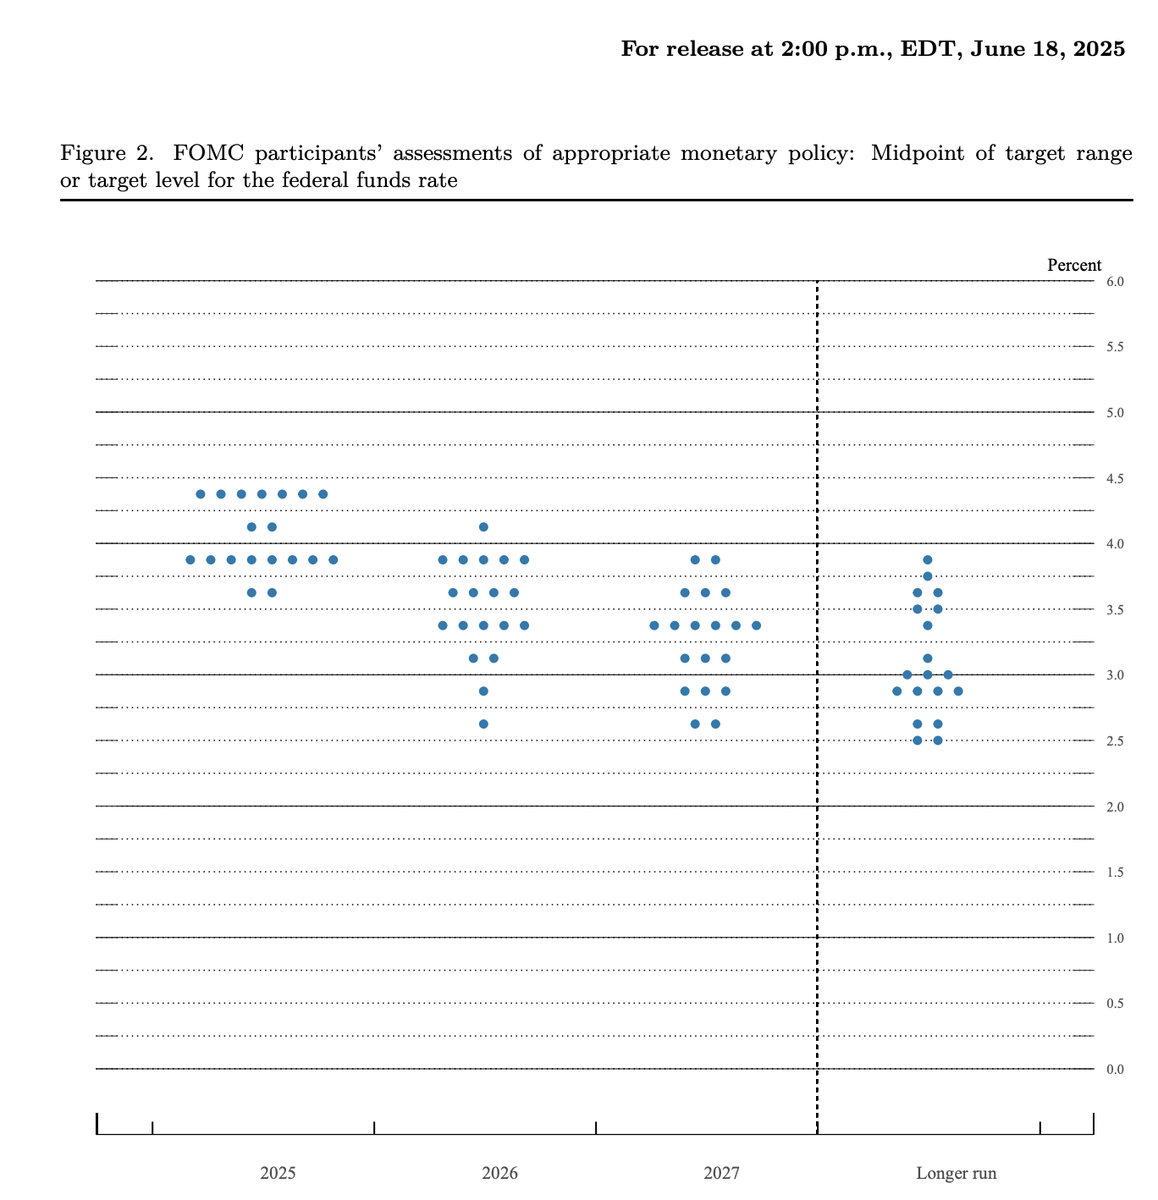
Interesting random multimodal AI model limitation, no model I have tried so far can read the Fed dot plot chart properly and turn it into structured data (counts by level by year, say). I tried o3-pro, gemini 2.5, claude opus 4. Weird right?

Interesting random multimodal AI model limitation, no model I have tried so far can read the Fed dot plot chart properly and turn it into structured data (counts by level by year, say). I tried o3-pro, gemini 2.5, claude opus 4. Weird right?
Warren Pies (@warrenpies) 's Twitter Profile Photo

AI adoption by U.S. businesses taking off Based on Fernando Vidal work, daily tokens generated to ~4X by the end of 2026. So much time spent thinking about market's downside risk (rightfully) but the potential productivity boom could/should start to show up in S&P 500 results soon.
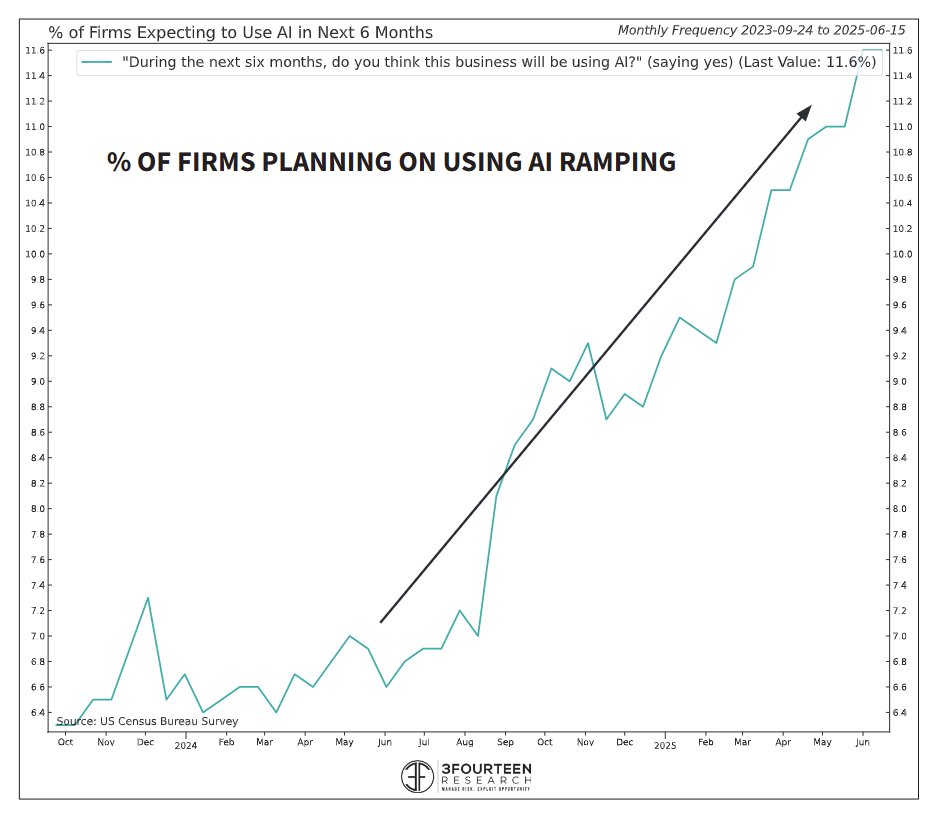
AI adoption by U.S. businesses taking off

Based on <a href="/fernavid/">Fernando Vidal</a> work, daily tokens generated to ~4X by the end of 2026.

So much time spent thinking about market's downside risk (rightfully) but the potential productivity boom could/should start to show up in S&amp;P 500 results soon.
Fernando Vidal (@fernavid) 's Twitter Profile Photo

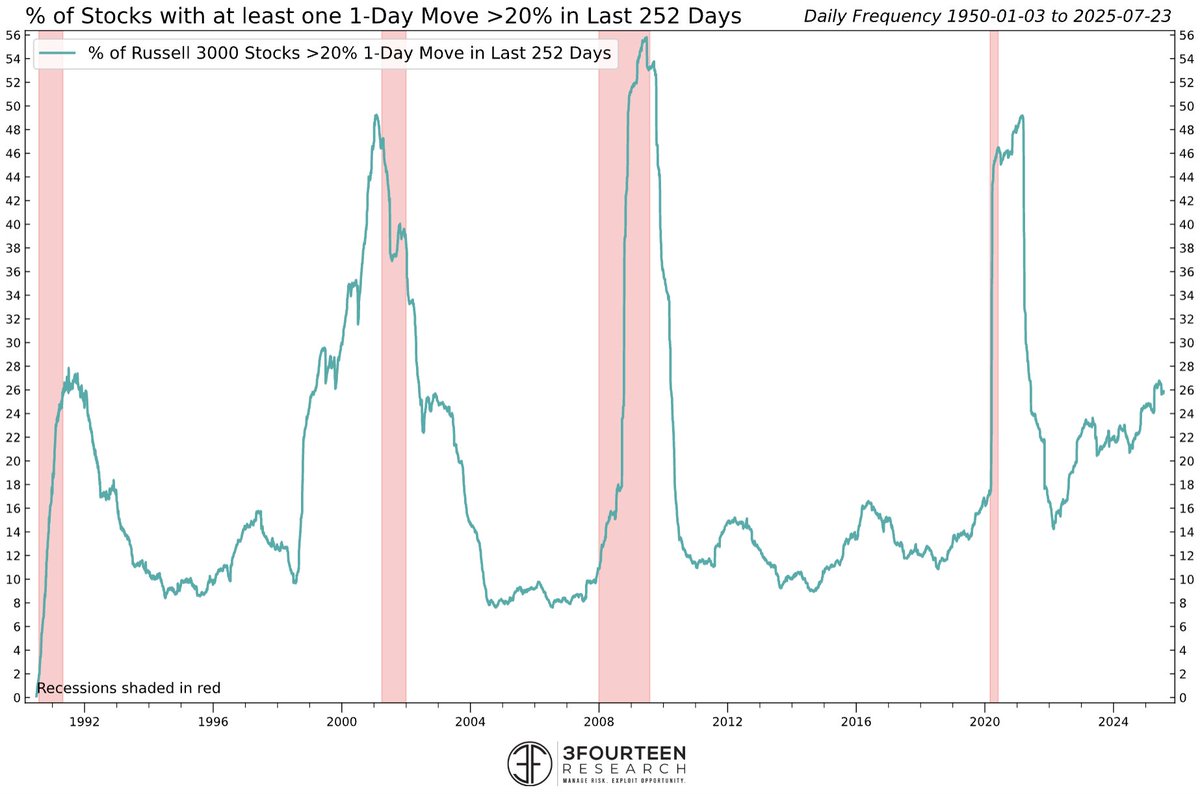
Big moves in individual stocks are happening at a historically high rate. Chart shows the percent of Russell 3000 stocks that have moved up more than 20% in a single day over the past 252 trading days.

Big moves in individual stocks are happening at a historically high rate. Chart shows the percent of Russell 3000 stocks that have moved up more than 20% in a single day over the past 252 trading days.