Fernando Franco (@fdo_franco) 's Twitter Profile
Fernando Franco

@fdo_franco

Statistician | Data Analyst | Data scientist | Las cifras dicen siempre lo que un hombre inteligente quiere que digan

ID: 204546033

calendar_today18-10-2010 23:12:39

107 Tweet

138 Takipçi

338 Takip Edilen

🔥 Matt Dancho (Business Science) 🔥 (@mdancho84) 's Twitter Profile Photo

Customer lifetime value is the most important number for a business. But 90% of data scientists struggle with CLV. Let's fix that. I have a free live CLV + Bayesian training (Feb 28th at 2PM EST): us02web.zoom.us/webinar/regist… Here's a glimpse of what's inside: 1. Customer Lifetime

Customer lifetime value is the most important number for a business. But 90% of data scientists struggle with CLV. Let's fix that.

I have a free live CLV + Bayesian training (Feb 28th at 2PM EST): us02web.zoom.us/webinar/regist…

Here's a glimpse of what's inside:

1. Customer Lifetime
🔥 Matt Dancho (Business Science) 🔥 (@mdancho84) 's Twitter Profile Photo

No matter how long I’ve been doing data science, I still get smacked in the face every once in a while. True story. Listen, I’ve been coding in R since 2013. I’ve published 10 R packages now. The top 3 combine for over 2,500,000 downloads and are used at every major company

No matter how long I’ve been doing data science, I still get smacked in the face every once in a while. True story.

Listen, I’ve been coding in R since 2013.

I’ve published 10 R packages now. The top 3 combine for over 2,500,000 downloads and are used at every major company
🔥 Matt Dancho (Business Science) 🔥 (@mdancho84) 's Twitter Profile Photo

Forecasting time series is what made me stand out as a data scientist. But it took me 1 year to master ARIMA. In 1 minute, I'll teach you what took me 1 year. Let's go. 1. ARIMA and SARIMA are both statistical models used for forecasting time series data, where the goal is to

Forecasting time series is what made me stand out as a data scientist. But it took me 1 year to master ARIMA. In 1 minute, I'll teach you what took me 1 year. Let's go.

1. ARIMA and SARIMA are both statistical models used for forecasting time series data, where the goal is to
🔥 Matt Dancho (Business Science) 🔥 (@mdancho84) 's Twitter Profile Photo

Understanding P-Values is essential for improving regression models. In 2 minutes, learn what took me 2 years to figure out. 1. The p-value: A p-value, in statistics, is a measure used to assess the strength of the evidence against a null hypothesis. 2. Null Hypothesis (H0):

Understanding P-Values is essential for improving regression models. In 2 minutes, learn what took me 2 years to figure out.

1. The p-value: A p-value, in statistics, is a measure used to assess the strength of the evidence against a null hypothesis.

2. Null Hypothesis (H0):
🔥 Matt Dancho (Business Science) 🔥 (@mdancho84) 's Twitter Profile Photo

A big mistake I see data scientists making: Learning tools they never use. I did this. And here’s how to fix it. A classic case of learning everything is mean, median, and mode. Data scientists learn how to use all 3 of these. Median and mean I use almost every day. But I can

A big mistake I see data scientists making: Learning tools they never use. I did this. And here’s how to fix it.

A classic case of learning everything is mean, median, and mode.

Data scientists learn how to use all 3 of these.

Median and mean I use almost every day.

But I can
DANE Colombia (@dane_colombia) 's Twitter Profile Photo

📊¡Colombia tiene #LeydeEstadísticas! Con la Ley 2335, Colombia se convierte en uno de los países pioneros en regular y establecer una normatividad robusta y actualizada para la planeación, producción y difusión de estadísticas. 👀 youtu.be/D_B9orDzjDc

🔥 Matt Dancho (Business Science) 🔥 (@mdancho84) 's Twitter Profile Photo

R-squared is one of the most commonly used metrics to measure performance. But it took me 2 years to figure out mistakes that were killing my regression models. In 2 minutes, I'll share how I fixed 2 years of mistakes (and made 50% more accurate models than my peers). Let's go:

R-squared is one of the most commonly used metrics to measure performance. But it took me 2 years to figure out mistakes that were killing my regression models. In 2 minutes, I'll share how I fixed 2 years of mistakes (and made 50% more accurate models than my peers). Let's go:
🔥 Matt Dancho (Business Science) 🔥 (@mdancho84) 's Twitter Profile Photo

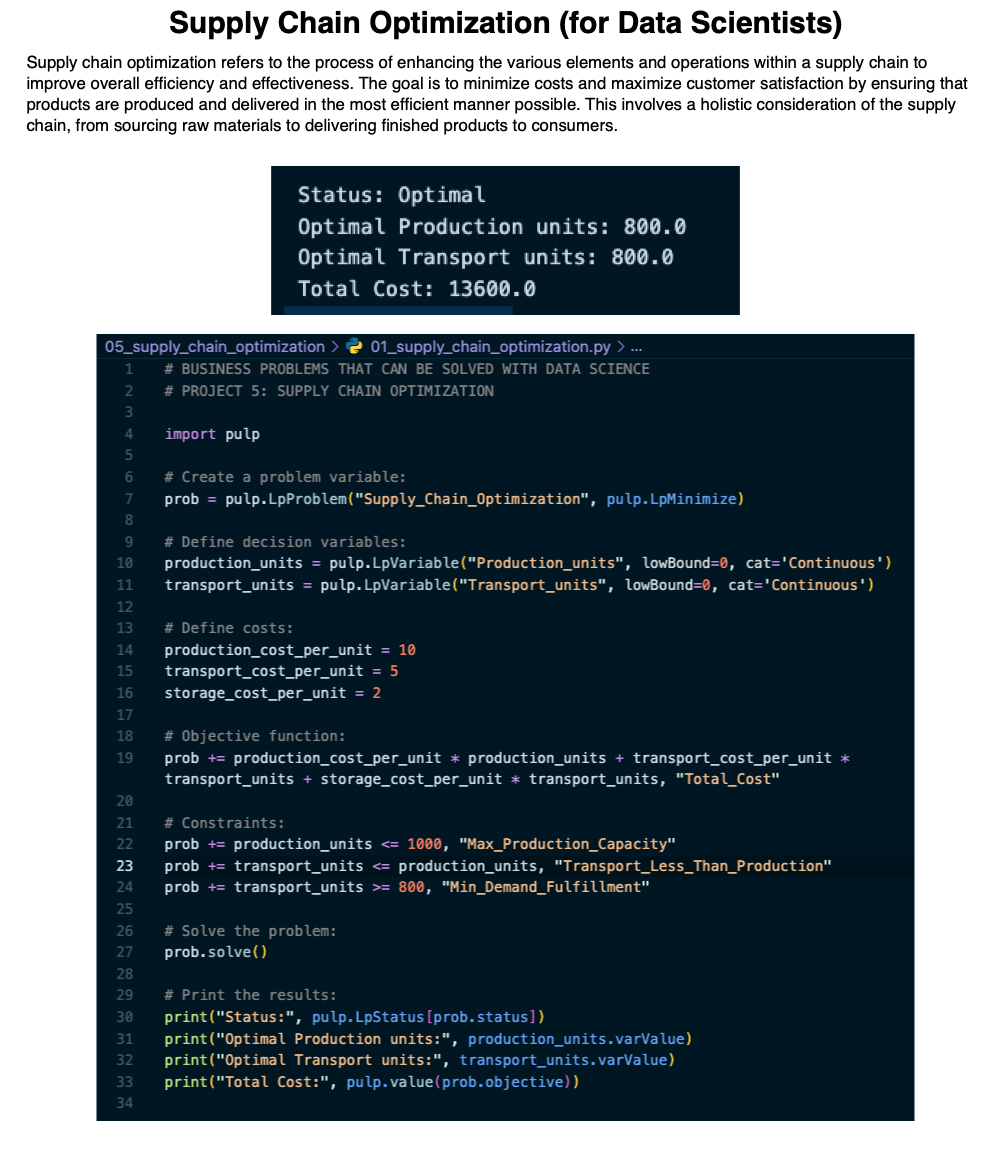
Supply Chain Optimization is a critical area where businesses can leverage Data Science. In the next 2 minutes, I’ll explain how data science can improve supply chain management (with R and Python Starter Supply Chain Projects). Let's dive in: Data science offers powerful tools

Supply Chain Optimization is a critical area where businesses can leverage Data Science. In the next 2 minutes, I’ll explain how data science can improve supply chain management (with R and Python Starter Supply Chain Projects). Let's dive in:

Data science offers powerful tools
🔥 Matt Dancho (Business Science) 🔥 (@mdancho84) 's Twitter Profile Photo

Fraud Detection is a business problem that can be solved with data science. In 2 minutes, I'll break it down and share how to make #Python and #Rstats fraud detection projects for your target audience. Let’s go! Fraud detection is a set of activities undertaken to prevent money

Fraud Detection is a business problem that can be solved with data science. In 2 minutes, I'll break it down and share how to make #Python and #Rstats fraud detection projects for your target audience. Let’s go!

Fraud detection is a set of activities undertaken to prevent money
🔥 Matt Dancho (Business Science) 🔥 (@mdancho84) 's Twitter Profile Photo

As a data scientist who uses R regularly, one of my biggest use cases for ChatGPT is helping me to build R Shiny Web Applications faster. Case in point-- ChatGPT helped me build this Shiny App in 15 minutes. It's a simple Shiny App that takes a user's Excel Spreadsheet,

As a data scientist who uses R regularly, one of my biggest use cases for ChatGPT is helping me to build R Shiny Web Applications faster. 

Case in point-- ChatGPT helped me build this Shiny App in 15 minutes. 

It's a simple Shiny App that takes a user's Excel Spreadsheet,
Rosana Ferrero 📈📊🙌 (@rosanaferrero) 's Twitter Profile Photo

📣 10 consejos para evaluar estadísticas, datos y gráficos de forma crítica. La guía de Royal Statistical Society nos enseña a identificar información confiable y evitar engaños. Las estadísticas son cruciales para entender el mundo que nos rodea. buff.ly/45And28 #stats #datascience
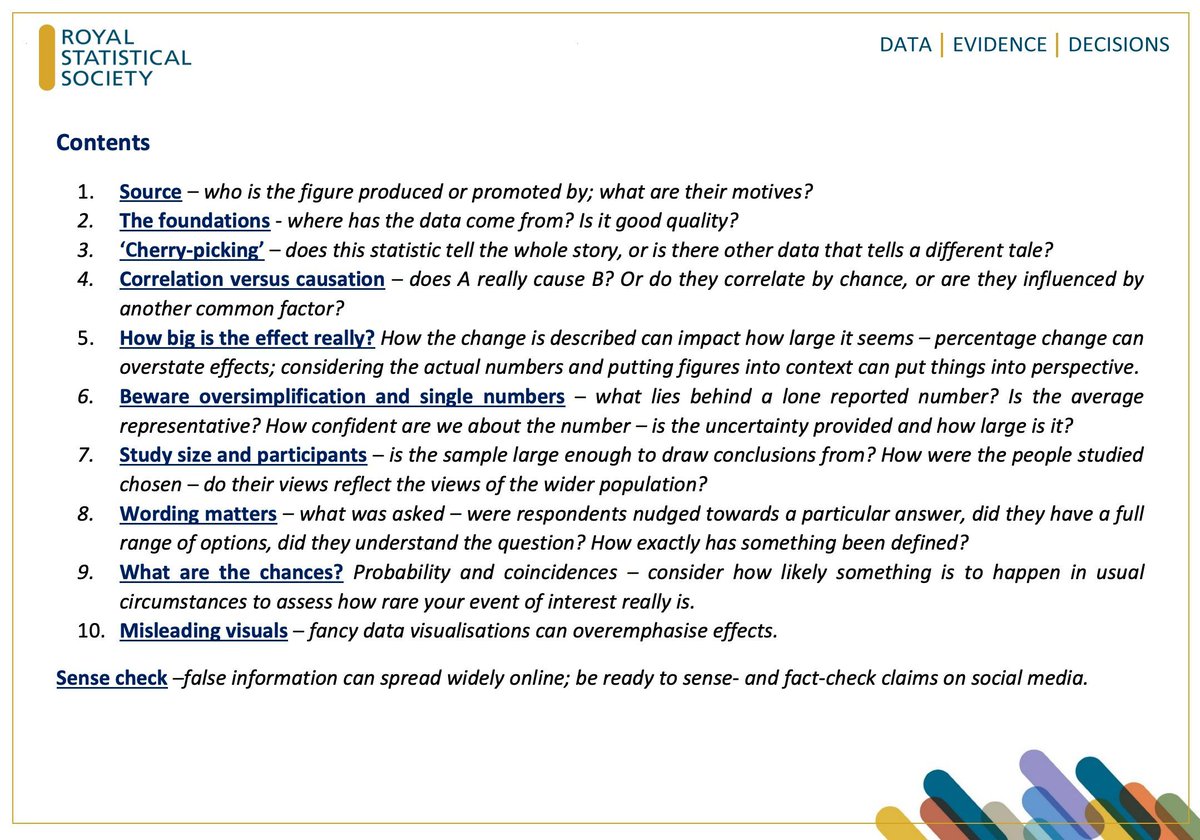
📣 10 consejos para evaluar estadísticas, datos y gráficos de forma crítica. La guía de <a href="/RoyalStatSoc/">Royal Statistical Society</a> nos enseña a identificar información confiable y evitar engaños.
Las estadísticas son cruciales para entender el mundo que nos rodea.
buff.ly/45And28 
#stats #datascience
Camilo Martínez Burgos (@camartinezbu) 's Twitter Profile Photo

¿Quieres mejorar la apariencia del dashboard que acabas de hacer con shiny? Encontré este libro que describe cosas desde modificar los temas en {bslib} hasta temas que requieren conocimiento de diseño web como React. Le puedes echar un ojo acá: unleash-shiny.rinterface.com

¿Quieres mejorar la apariencia del dashboard que acabas de hacer con shiny?

Encontré este libro que describe cosas desde modificar los temas en {bslib} hasta temas que requieren conocimiento de diseño web como React.

Le puedes echar un ojo acá:
unleash-shiny.rinterface.com
Rosana Ferrero 📈📊🙌 (@rosanaferrero) 's Twitter Profile Photo

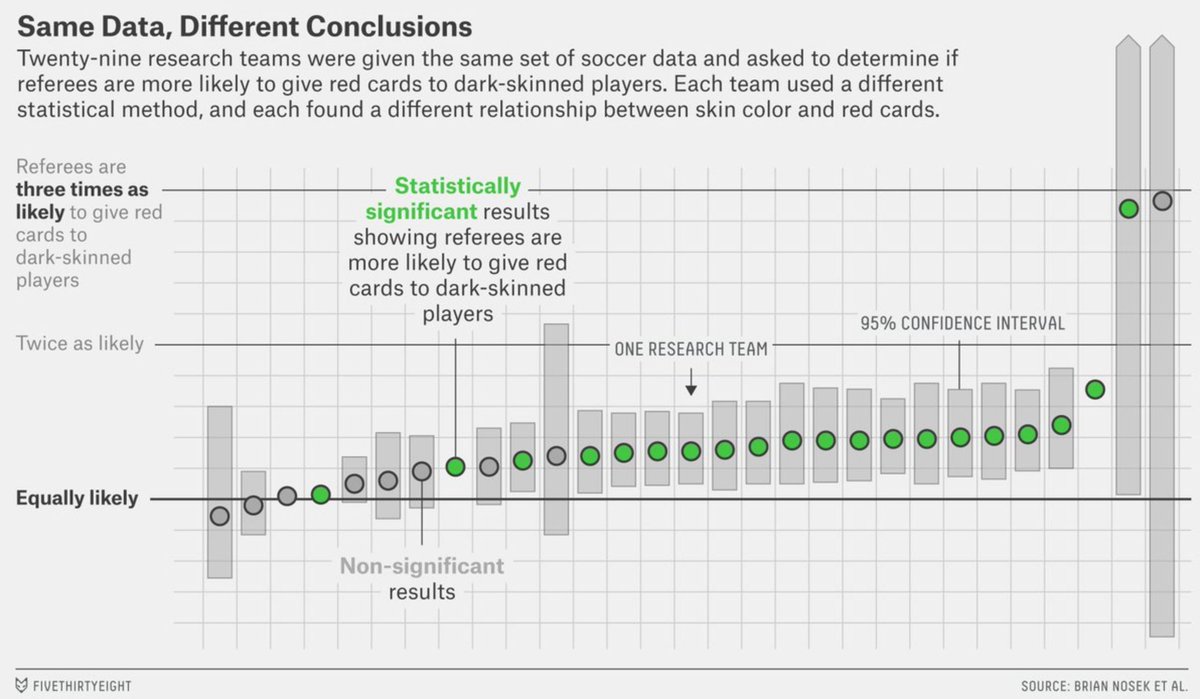
🧠 Recuerda: las decisiones analíticas, aunque estén bien fundamentadas, pueden influir en los resultados de la investigación. Qué variables incluir en el modelo, cómo manejar outliers y NA, qué método elegir, etc. #DataScience #stats #analytics #research buff.ly/31wSFfb

🧠 Recuerda: las decisiones analíticas, aunque estén bien fundamentadas, pueden influir en los resultados de la investigación.
Qué variables incluir en el modelo, cómo manejar outliers y NA, qué método elegir, etc.
#DataScience #stats #analytics #research
buff.ly/31wSFfb