TML Trader (@tmltrader) 's Twitter Profile
TML Trader

@tmltrader

Growth Stock Investor. Focused on finding & trading True Market Leaders. Lead PM tickermonkey.com/tml TML Model Portfolio.

ID: 2715646770

linkhttp://tickermonkey.com calendar_today08-08-2014 00:14:59

13,13K Tweet

89,89K Followers

86 Following

TML Trader (@tmltrader) 's Twitter Profile Photo

Weekend Review, 8/17: 80% to 100% Exposure Nasdaq & S&P 500 finished at all-time weekly closing highs. Russell 2000 outperformed as it confirmed a new higher high. Distribution days: Nasdaq - 3, S&P 500 - 5 $SPY $QQQ Charts courtesy of MarketSurge
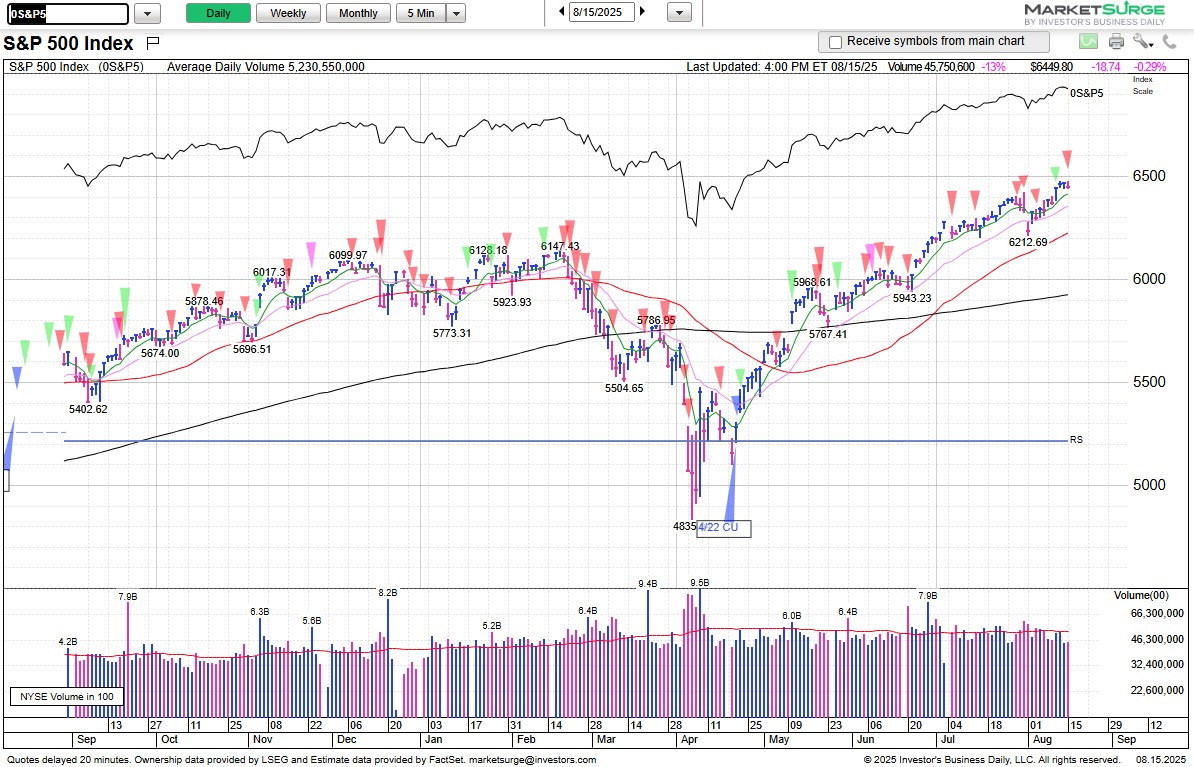
Weekend Review, 8/17: 80% to 100% Exposure

Nasdaq & S&P 500 finished at all-time weekly closing highs.

Russell 2000 outperformed as it confirmed a new higher high.

Distribution days: Nasdaq - 3, S&P 500 - 5

$SPY $QQQ

Charts courtesy of <a href="/marketsurge/">MarketSurge</a>
TML Trader (@tmltrader) 's Twitter Profile Photo

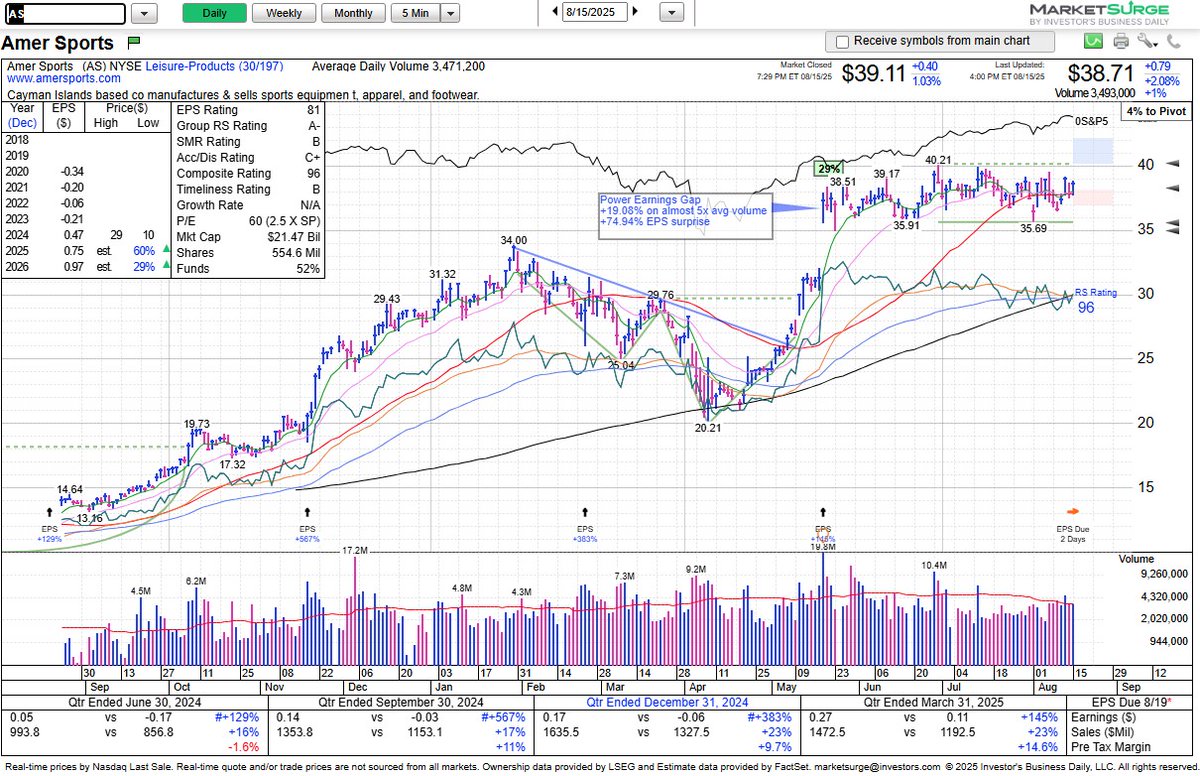
$AS regained the 50-day/10-week SMA as it continued to trade in a flat base (40.21 std pivot).  Watch how it acts on earnings next week, 8/19, BMO.

$AS regained the 50-day/10-week SMA as it continued to trade in a flat base (40.21 std pivot).  Watch how it acts on earnings next week, 8/19, BMO.
TML Trader (@tmltrader) 's Twitter Profile Photo

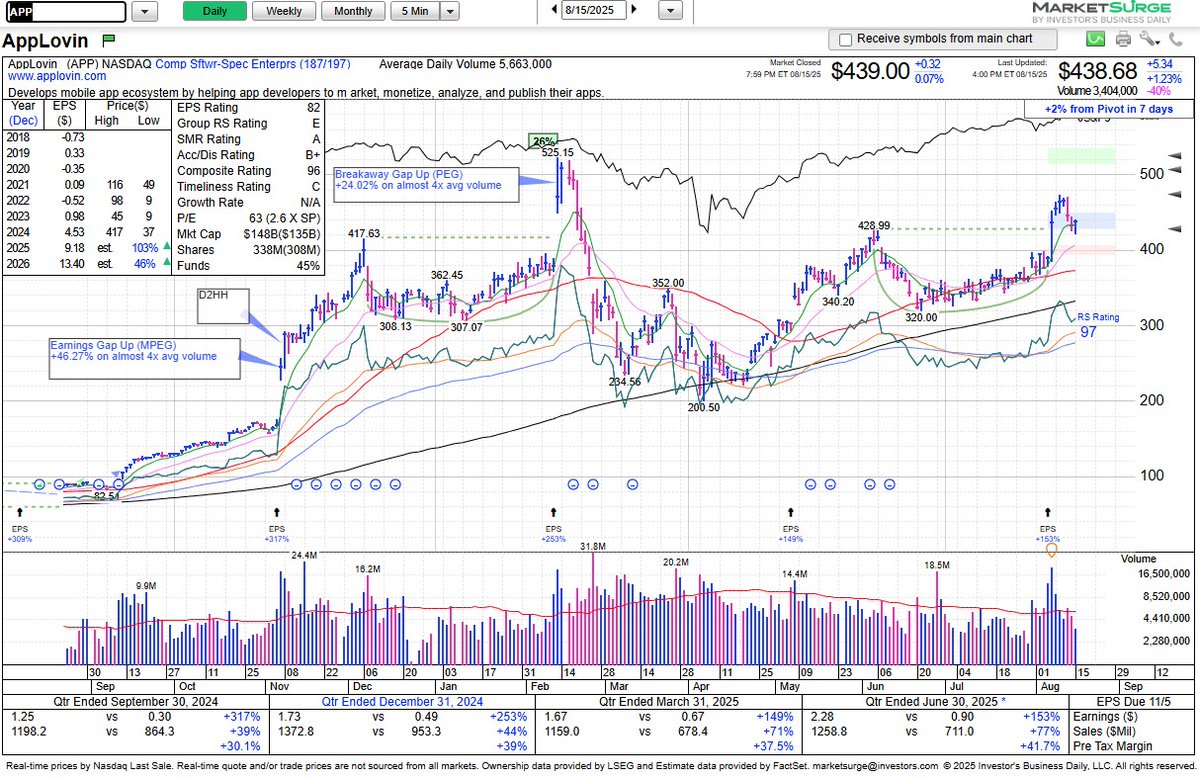
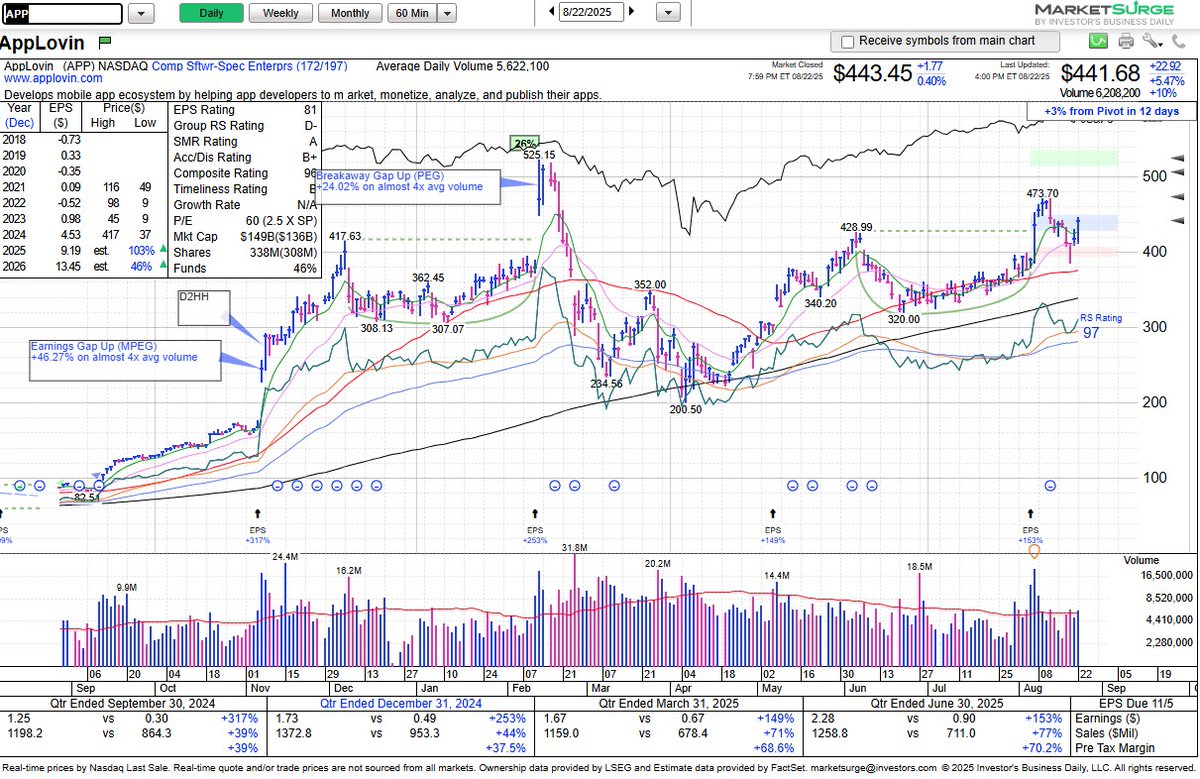
$APP broke out of a first stage cup base (428.99 std pivot) on earnings, then followed up with 3 days of gains before pulling back to test the pivot. It may be working on a high handle.

$APP broke out of a first stage cup base (428.99 std pivot) on earnings, then followed up with 3 days of gains before pulling back to test the pivot. It may be working on a high handle.
TML Trader (@tmltrader) 's Twitter Profile Photo

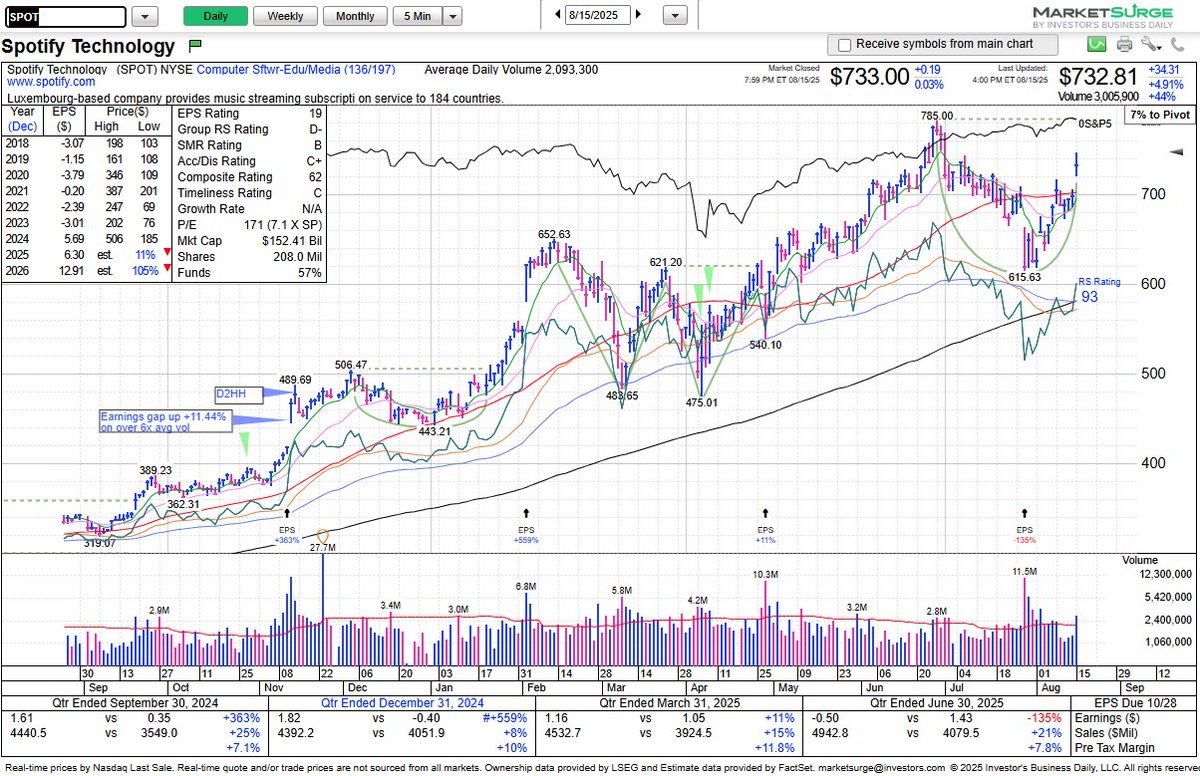
$SPOT reclaimed the 10-week/50-day line and formed the right side of a new cup base (785 std pivot).  Watch if it forms a handle.

$SPOT reclaimed the 10-week/50-day line and formed the right side of a new cup base (785 std pivot).  Watch if it forms a handle.
TML Trader (@tmltrader) 's Twitter Profile Photo

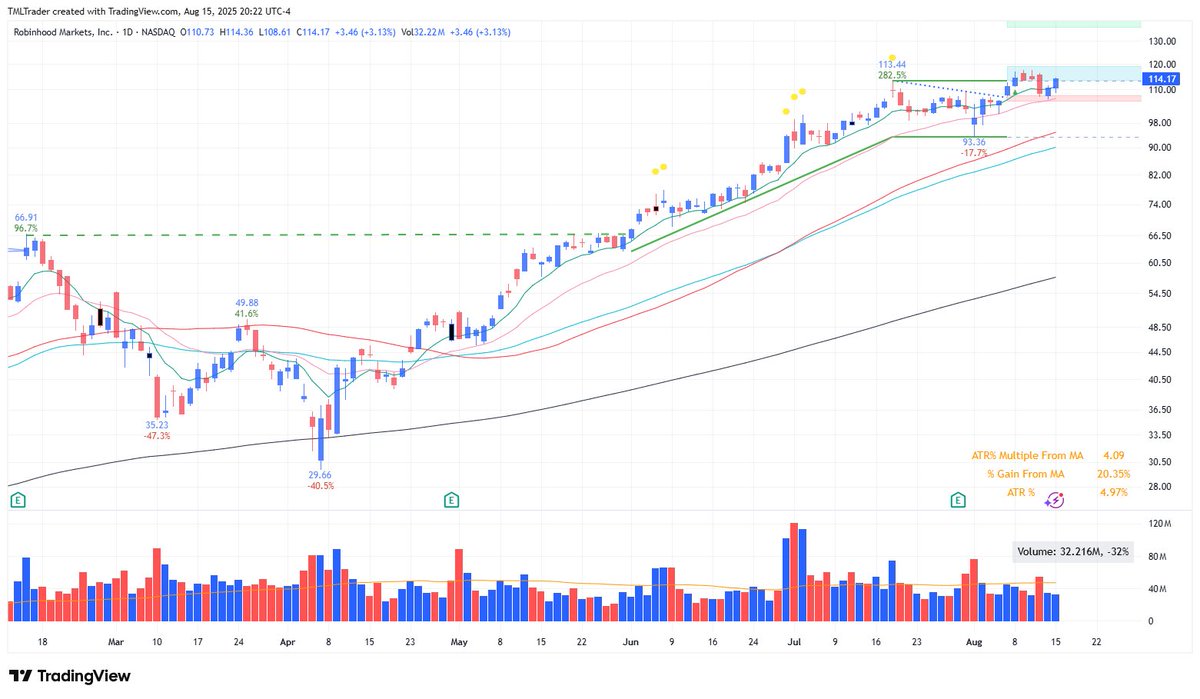
$HOOD pulled back and found support at the 21-day EMA following a breakout failure from a high, tight flag.  On Friday, it rebounded and reclaimed the 113.44 pivot. HOOD had a strong prior uptrend with two sets of 5 straight up weeks (10 of 11 up weeks) and blue skyscrapers.

$HOOD pulled back and found support at the 21-day EMA following a breakout failure from a high, tight flag.  On Friday, it rebounded and reclaimed the 113.44 pivot. HOOD had a strong prior uptrend with two sets of 5 straight up weeks (10 of 11 up weeks) and blue skyscrapers.
TML Trader (@tmltrader) 's Twitter Profile Photo

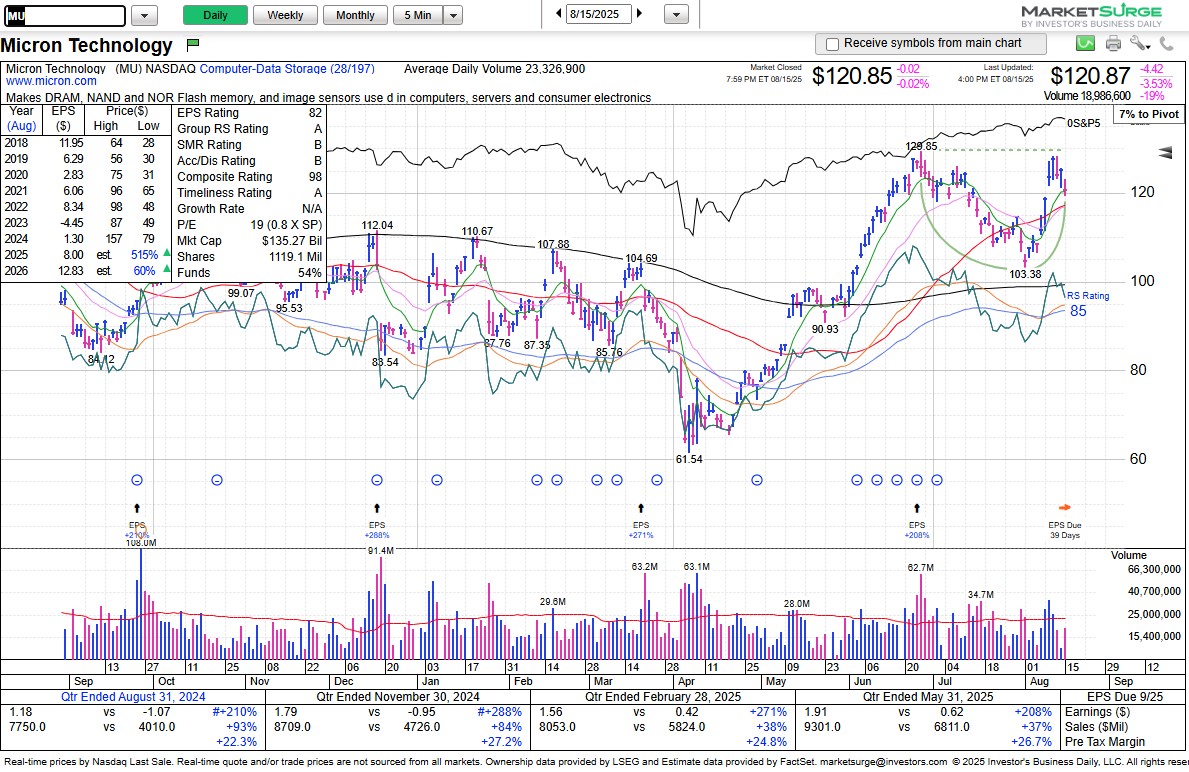
$MU formed the right side of a first stage cup base (129.85 std pivot). Prior uptrend showed accumulation with 5 consecutive up weeks (10 of 11 up weeks). See if it forms a handle.

$MU formed the right side of a first stage cup base (129.85 std pivot). Prior uptrend showed accumulation with 5 consecutive up weeks (10 of 11 up weeks). See if it forms a handle.
TML Trader (@tmltrader) 's Twitter Profile Photo

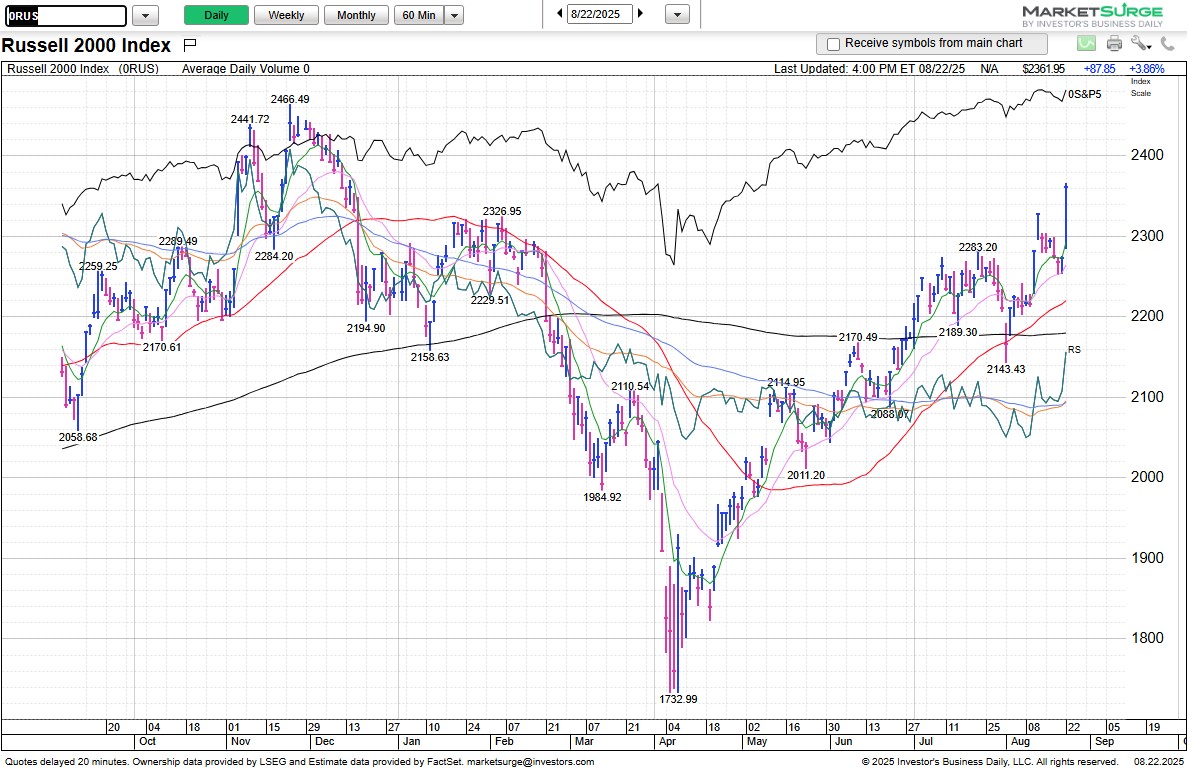
Weekend Review, 8/24: 80% to 100% Exposure Nasdaq & S&P 500 logged accumulation days on Friday as they regained their respective 21-day EMA. Small and mid cap stock indexes outperformed. Distribution days: Nasdaq - 5, S&P 500 - 6 $SPY $QQQ $IWM $MDY Charts courtesy of

Weekend Review, 8/24: 80% to 100% Exposure

Nasdaq &amp; S&amp;P 500 logged accumulation days on Friday as they regained their respective 21-day EMA.

Small and mid cap stock indexes outperformed.

Distribution days: Nasdaq - 5, S&amp;P 500 - 6

$SPY $QQQ $IWM $MDY

Charts courtesy of
TML Trader (@tmltrader) 's Twitter Profile Photo

Setups and Watch List, 8/24: $CRDO $ANET $CCJ $CLS $NVDA $APP $ALAB $SOFI $AS Check out the TML Model at tickermonkey.com/tml

TML Trader (@tmltrader) 's Twitter Profile Photo

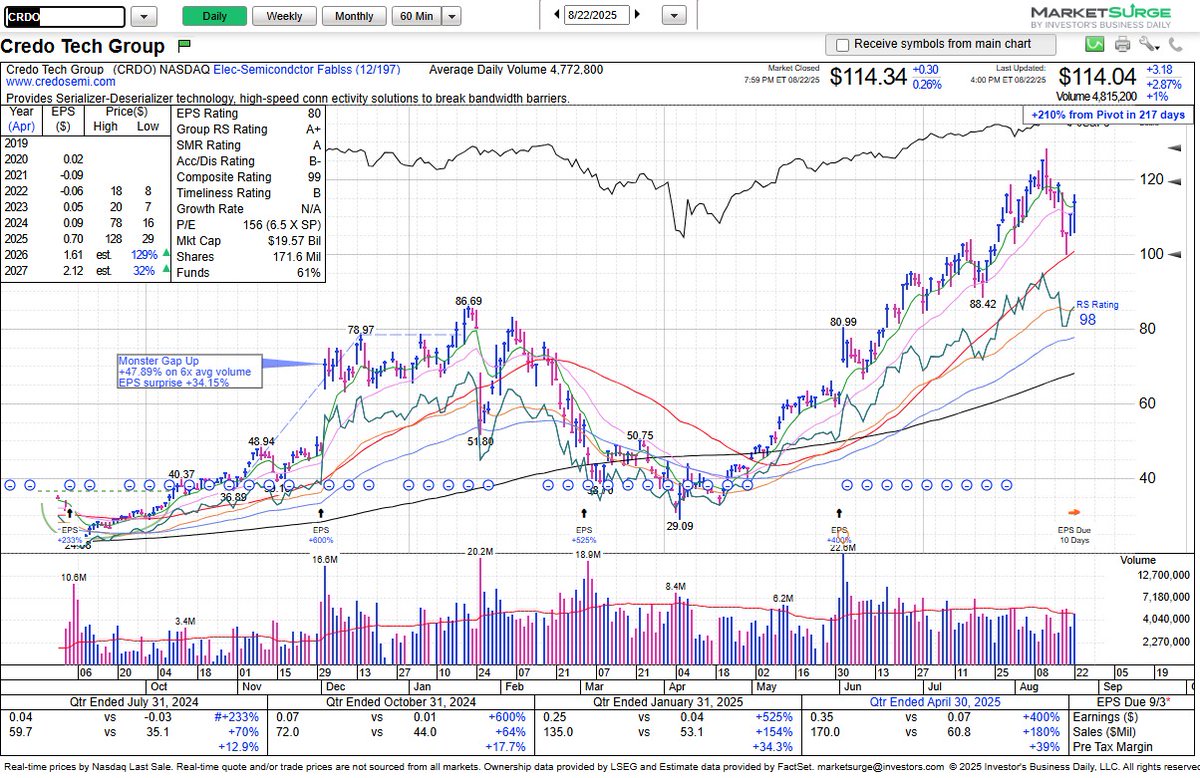
$CRDO pulled back to test the 10-week/50-day SMA for the first time since breaking out of a large 5-month long consolidation. It reclaimed the 21-day EMA on Friday after rebounding off the 10-week/50-day SMA. EPS on 9/3, AMC

$CRDO pulled back to test the 10-week/50-day SMA for the first time since breaking out of a large 5-month long consolidation. It reclaimed the 21-day EMA on Friday after rebounding off the 10-week/50-day SMA. EPS on 9/3, AMC
TML Trader (@tmltrader) 's Twitter Profile Photo

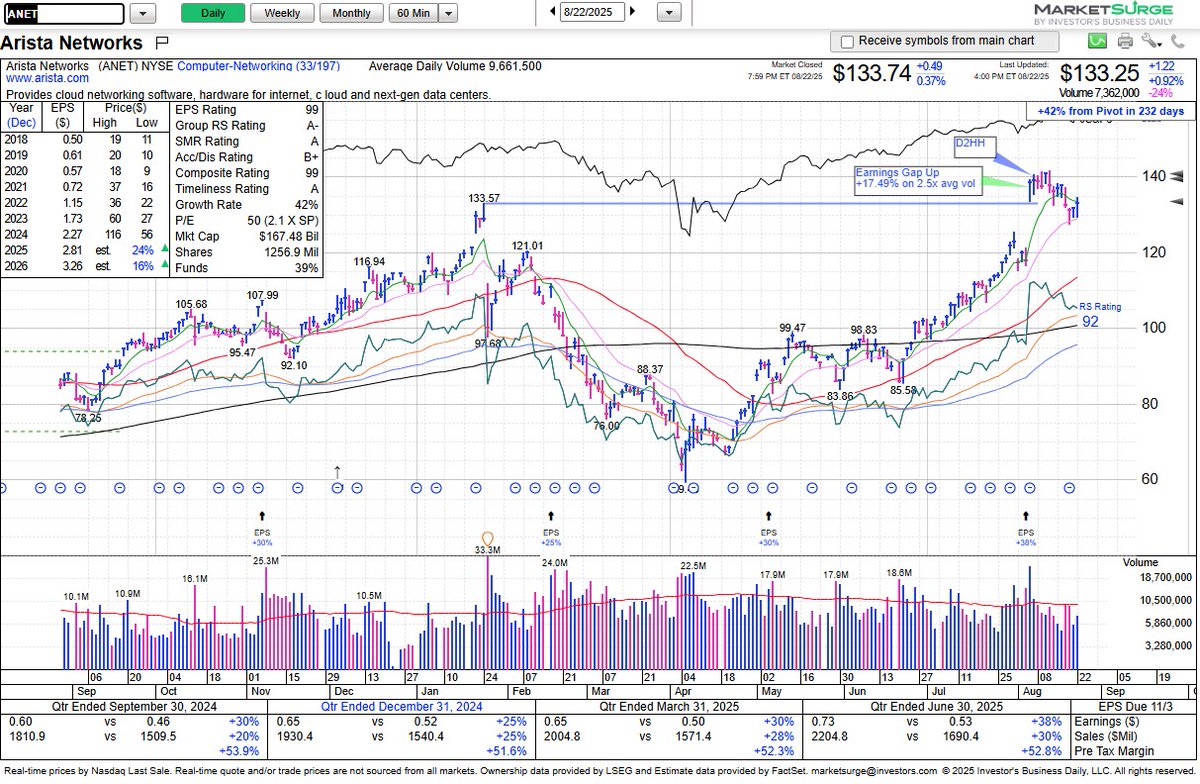
$ANET rebounded after finding support at the 21-day EMA and ended the week just below the range of its earnings gap and the prior all-time high of 133.57.

$ANET rebounded after finding support at the 21-day EMA and ended the week just below the range of its earnings gap and the prior all-time high of 133.57.
TML Trader (@tmltrader) 's Twitter Profile Photo

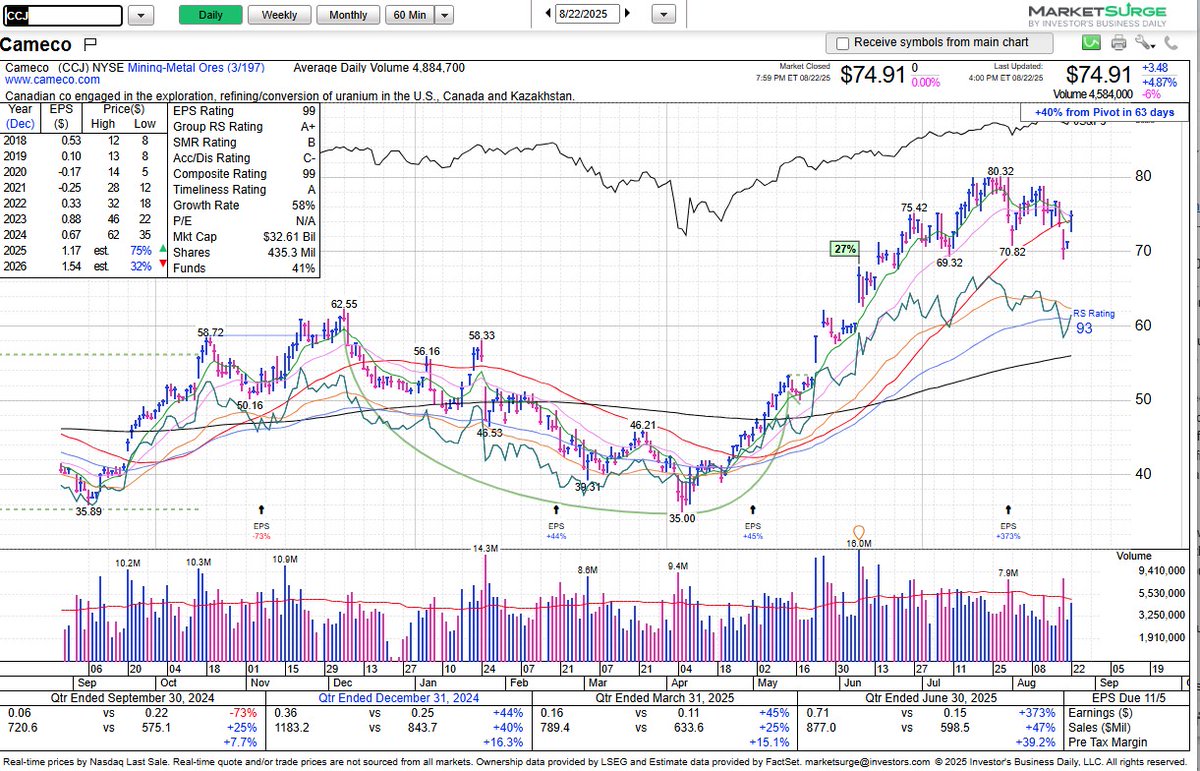
$CCJ regained the 50-day/10-week SMA on Friday after closing below these major moving averages in the prior 3 days. It closed just below the 21-day EMA. Now in its 4th week of consolidation, it may complete a flat base next week (80.32 std pivot). CCJ had a strong uptrend as it

$CCJ regained the 50-day/10-week SMA on Friday after closing below these major moving averages in the prior 3 days. It closed just below the 21-day EMA. Now in its 4th week of consolidation, it may complete a flat base next week (80.32 std pivot). CCJ had a strong uptrend as it
TML Trader (@tmltrader) 's Twitter Profile Photo

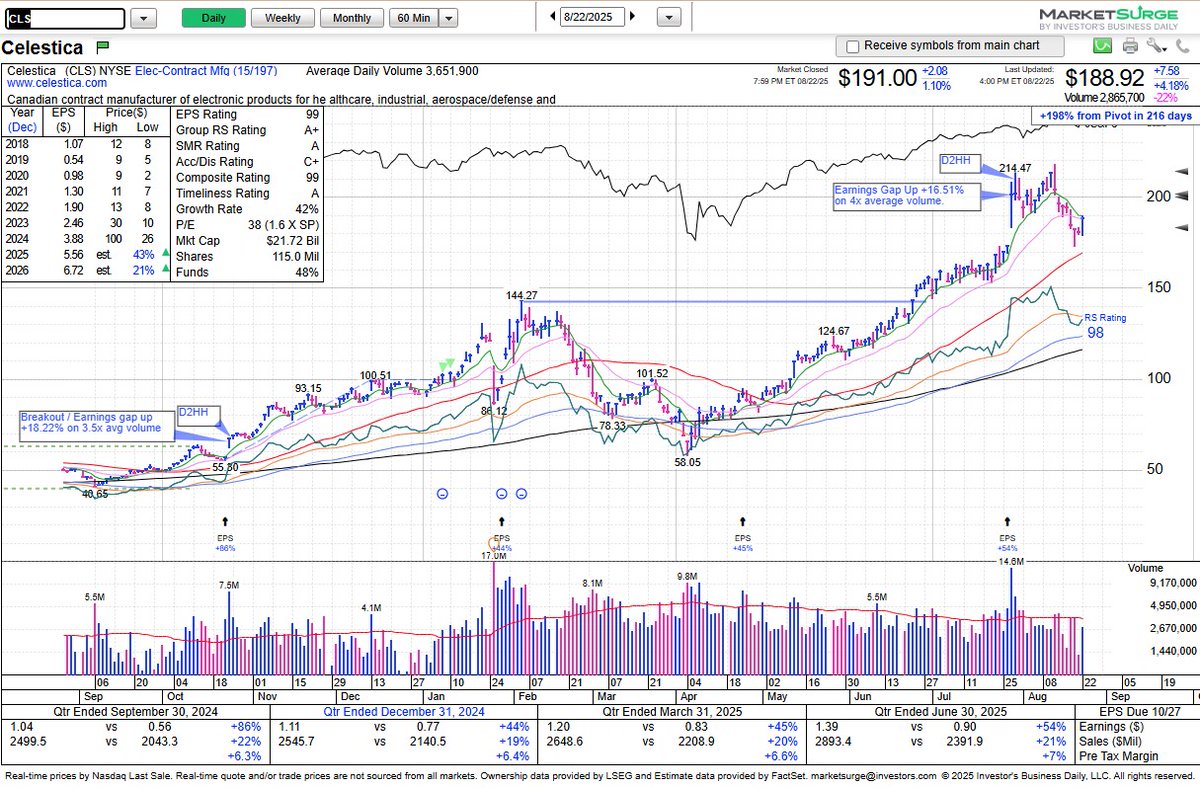
$CLS pulled back to test the 10-week SMA for the first time since clearing the top of a 6-month deep consolidation. It reclaimed the 21-day EMA and the range of its earnings gap on Friday. It may be working on a new base but see if the 21-day EMA or the 10-week SMA will provide

$CLS pulled back to test the 10-week SMA for the first time since clearing the top of a 6-month deep consolidation. It reclaimed the 21-day EMA and the range of its earnings gap on Friday. It may be working on a new base but see if the 21-day EMA or the 10-week SMA will provide
TML Trader (@tmltrader) 's Twitter Profile Photo

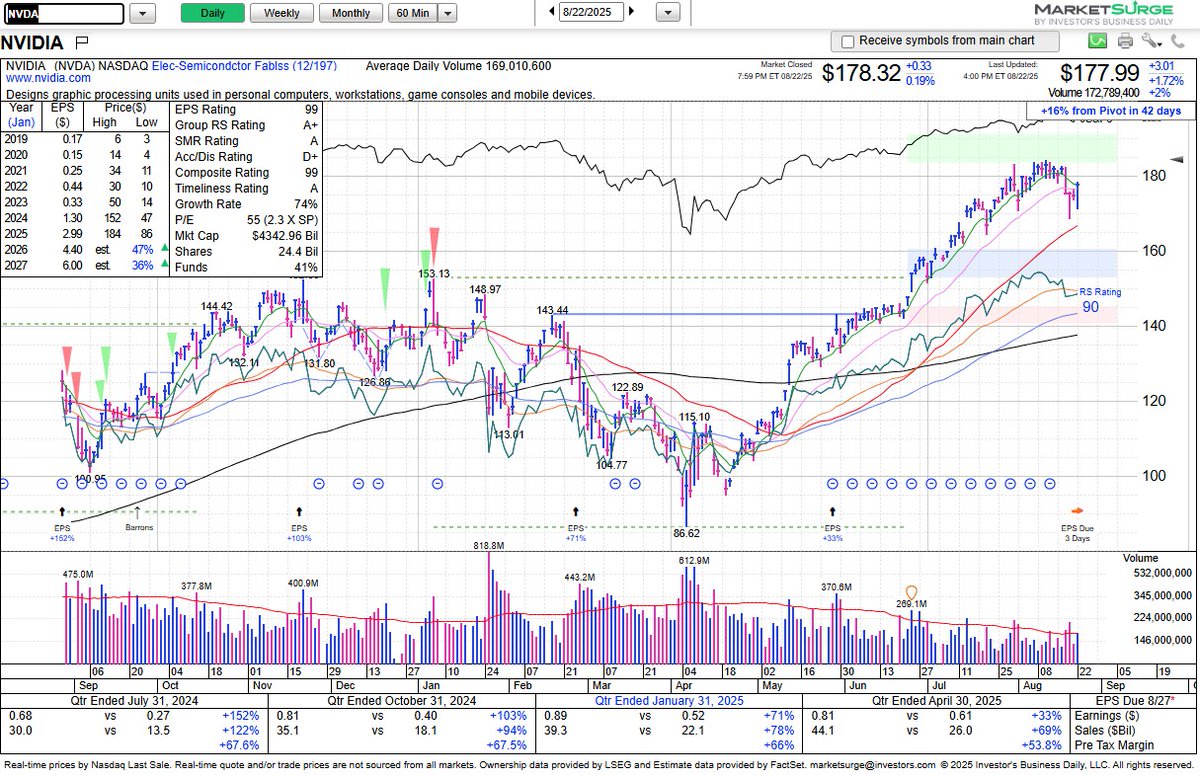
$NVDA staged a positive outside reversal on Friday as it reclaimed the 21-day EMA after finding support at the 10-week SMA. It closed the week with another 3-weeks tight pattern (184.48 std pivot). Last week was NVDA's first pullback to the 10-week line since clearing a large

$NVDA staged a positive outside reversal on Friday as it reclaimed the 21-day EMA after finding support at the 10-week SMA.  It closed the week with another 3-weeks tight pattern (184.48 std pivot).  Last week was NVDA's first pullback to the 10-week line since clearing a large
TML Trader (@tmltrader) 's Twitter Profile Photo

$SOFI finished at a four-year closing high on above average volume as it tried to clear the tight flag pivot of 25.11 after an undercut and rally off the 21-day EMA. Look for an upside follow-through or see if it forms a handle. Charts courtesy of TradingView
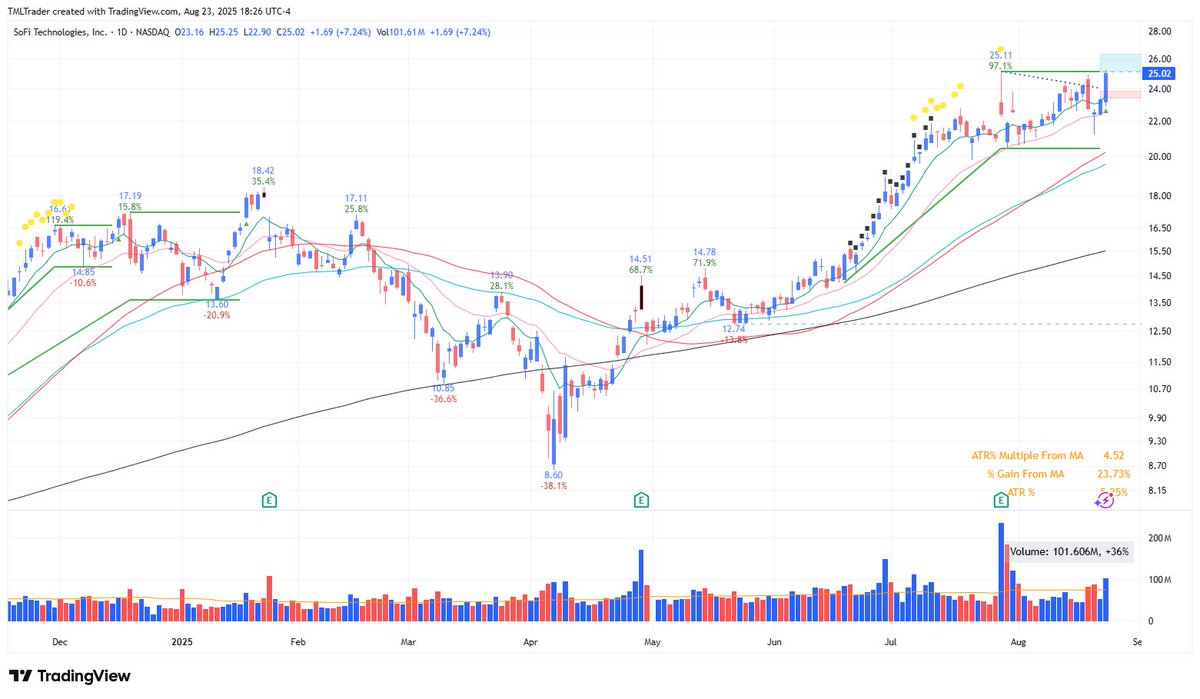
$SOFI finished at a four-year closing high on above average volume as it tried to clear the tight flag pivot of 25.11 after an undercut and rally off the 21-day EMA. Look for an upside follow-through or see if it forms a handle.

Charts courtesy of <a href="/tradingview/">TradingView</a>
TML Trader (@tmltrader) 's Twitter Profile Photo

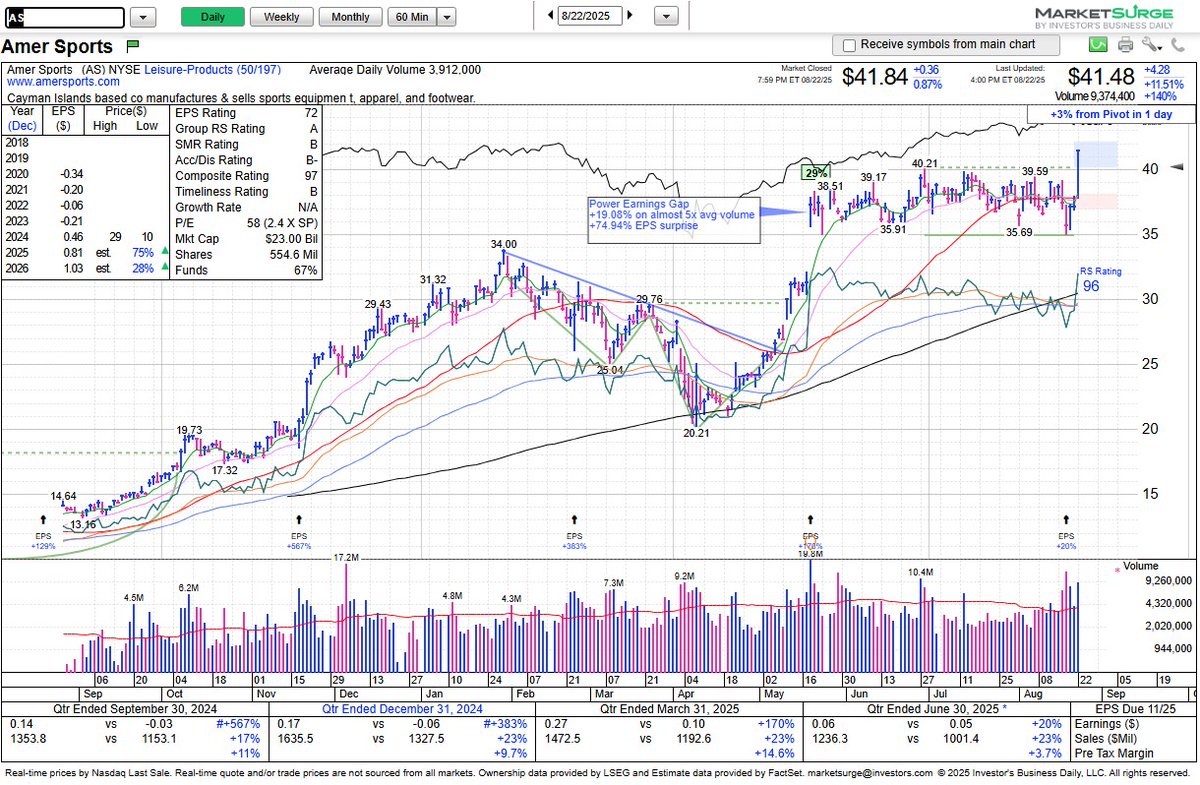
$AS reclaimed the 50-day/10-week SMA, then broke out of its flat base (40.21 std pivot) on heavy volume. It recovered nicely after a negative reaction to earnings on August 19.

$AS reclaimed the 50-day/10-week SMA, then broke out of its flat base (40.21 std pivot) on heavy volume. It recovered nicely after a negative reaction to earnings on August 19.