TCLTrader (@tcltrader) 's Twitter Profile
TCLTrader

@tcltrader

High Probability, Low Risk Entry Pullback & Reversal Setups following the style of Al Brooks (brookspriceaction.com) + IBD (investors.com)
IBD Meetup Leader

ID: 270920011

linkhttps://www.meetup.com/ibd-8/ calendar_today23-03-2011 14:09:17

999 Tweet

2,2K Followers

2,2K Following

TCLTrader (@tcltrader) 's Twitter Profile Photo

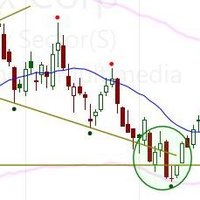
$SPY 2Min: Friday's price action had some important TCL lessons. When drawing a TCL, we need just 2 dots. But connecting A & C would cause price at B to violate the TCL. Thus it's necessary to move the TCL line slightly. Thus when price hits point D, we have a potential

$SPY 2Min:  Friday's price action had some important TCL lessons.

When drawing a TCL, we need just 2 dots. But connecting A & C would cause price at B to violate the TCL.  Thus it's necessary to move the TCL line slightly.  Thus when price hits point D, we have a potential
TCLTrader (@tcltrader) 's Twitter Profile Photo

$MRNA Daily. This stock is setting up for a major reversal. It's formed a TCL in the Bottom Danger Zone. Danger Zone Reversals often go sideways to down for a long time but when they do reverse the returns can be huge. $SMCI is a recent example (see next post) Please Note:

$MRNA Daily.  This stock is setting up for a major reversal.  It's formed a TCL in the Bottom Danger Zone.  
Danger Zone Reversals often go sideways to down for a long time but when they do reverse the returns can be huge.  $SMCI is a recent example (see next post)

Please Note:
TCLTrader (@tcltrader) 's Twitter Profile Photo

$SMCI Daily. This is an example of a Recent Danger Zone Reversal that worked. The initial entry was in Nov 2024. It went sideways for many months before taking off the in the last 2 weeks. It did form a TCL signal before the recent rally. The return from the last Danger

$SMCI Daily.  This is an example of a Recent Danger Zone Reversal that worked.  The initial entry was in Nov 2024.   It went sideways for many months before taking off the in the last 2 weeks.   It did form a TCL signal before the recent rally.   The return from the last Danger
TCLTrader (@tcltrader) 's Twitter Profile Photo

$QQQ 2Min. Today's intraday chart shows how the TCLs highlighted some of the Key Turning Points. The best TCL Setups are the ones in green, although the other TCL Setups did work. The Key Trade of the Day was the TCL Reversal at ~2PM ET.

$QQQ 2Min.  Today's intraday chart shows how the TCLs highlighted some of the Key Turning Points.  The best TCL Setups are the ones in green, although the other TCL Setups did work.   The Key Trade of the Day was the TCL Reversal at ~2PM ET.
TCLTrader (@tcltrader) 's Twitter Profile Photo

$WGS Daily. This stock was one of the Big Winners today, up >~45% in a single day on Earnings. The Low Risk Entry was the Danger Zone TCL pullback about a week ago. It's too late to enter to enter and it's best to exit or lock in profits here. It's likely due for a

$WGS Daily.  This stock was one of the Big Winners today, up >~45% in a single day on Earnings.    The Low Risk Entry was the Danger Zone TCL pullback about a week ago.     

It's too late to enter to enter and it's best to exit or lock in profits here.  It's likely due for a
TCLTrader (@tcltrader) 's Twitter Profile Photo

$QQQ 2Min. Today there were only 2 TCL trades the entire day. The lower one at ~10AM ET called out the Low of the Day and was the Key Trade of the Day. The upper one at ~2:30PM ET was close to the High of the Day. A nice move rapid move from there to the 200MA.

$QQQ 2Min.  Today there were only 2 TCL trades the entire day.   The lower one at ~10AM ET called out the Low of the Day and was the Key Trade of the Day.  The upper one at ~2:30PM ET was close to the High of the Day.  A nice move rapid move from there to the 200MA.
TCLTrader (@tcltrader) 's Twitter Profile Photo

$T2108 Daily. This Worden indicator (% of Stocks Above the 40MA) has been a reliable indicator of market bottoms when it hits the Bottom Danger Zone. It has hit that area now. Look for a market bounce soon.

$T2108 Daily.  This Worden indicator (% of Stocks Above the 40MA) has been a reliable indicator of market bottoms when it hits the Bottom Danger Zone.   It has hit that area now.  Look for a market bounce soon.
TCLTrader (@tcltrader) 's Twitter Profile Photo

$SPX Daily. One of Al Brooks' teachings is that TCLs often act as Magnets for Price. The SPX has hit a TCL pullback area. Look for a market bounce in this area. A move above a green bar or a 2nd Attempt (H2 Long) will be the confirmation. (for new folks: TCLs are drawn by

$SPX Daily.  One of Al Brooks' teachings is that TCLs often act as Magnets for Price.   The SPX has hit a TCL pullback area.  Look for a market bounce in this area.  A move above a green bar or a 2nd Attempt (H2 Long) will be the confirmation.

(for new folks: TCLs are drawn by
TCLTrader (@tcltrader) 's Twitter Profile Photo

Tonight's Northern Virginia IBD Meetup meeting is canceled. We apologize for this. We will meet again next month, on Wed July 30th, 7PM ET. Please continue to do the homework: finding high probability income oriented setups & tracking them in Excel. We will review them at

TCLTrader (@tcltrader) 's Twitter Profile Photo

$SPX Daily. The market has been in a very strong up move. But we have the first TCL Reversal signal now. Look for a potential Reversal in this area. A strong Red Bar soon would be the confirmation. (for new folks: TCLs are drawn by connecting the dots & extending the line

$SPX Daily.  The market has been in a very strong up move.  But we have the first TCL Reversal signal now.  Look for a potential Reversal in this area.  A strong Red Bar soon would be the confirmation.

(for new folks: TCLs are drawn by connecting the dots & extending the line