Postholer - GIS Resources (@postholer) 's Twitter Profile
Postholer - GIS Resources

@postholer

GIS, Interactive & Printed Trail Maps, Data Books, Trip Planners, Snow, Wildfires, Gear Lists, Open Source. Portfolio: postholer.com/portfolio

ID: 29617124

linkhttps://www.postholer.com calendar_today08-04-2009 02:29:22

1,1K Tweet

738 Followers

151 Following

Postholer - GIS Resources (@postholer) 's Twitter Profile Photo

Tale of the Trail: Land Cover Change postholer.com/articles/Tale-… Introducing 28 years of land cover change on your favorite trail! This is the latest feature added to Postholer Interactive Maps. It's made possible by USGS and Multi-Resolution Land Cover Characterization

Tale of the Trail: Land Cover Change

postholer.com/articles/Tale-…

Introducing 28 years of land cover change on your favorite trail!  This is the latest feature added to Postholer Interactive Maps. It's made possible by <a href="/USGS/">USGS</a> and Multi-Resolution Land Cover Characterization
Postholer - GIS Resources (@postholer) 's Twitter Profile Photo

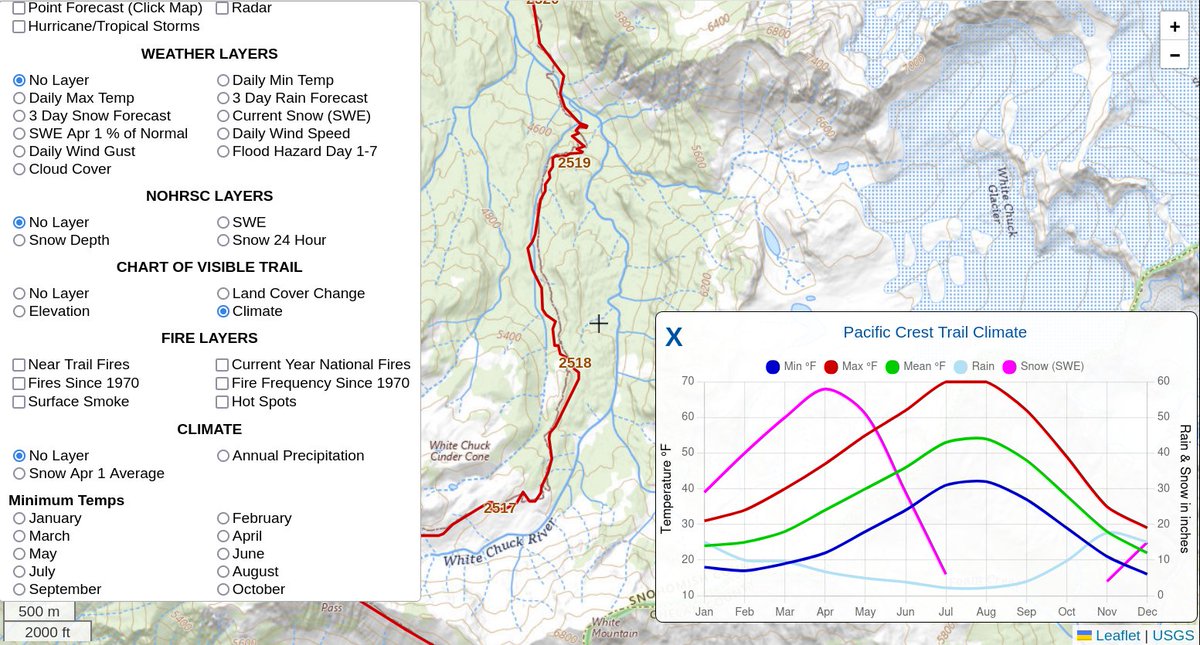
Get trail climate in chart format along any section of your favorite trail. Pick your favorite trail: postholer.com/trail-maps Click the 'Gear Icon', under 'Chart of Visible Trail', select 'Climate'. Pan/zoom to your desired location. Our latest feature will allow you to

Get trail climate in chart format along any section of your favorite trail. Pick your favorite trail:

postholer.com/trail-maps

Click the 'Gear Icon', under 'Chart of Visible Trail', select 'Climate'. Pan/zoom to your desired location.

Our latest feature will allow you to
Postholer - GIS Resources (@postholer) 's Twitter Profile Photo

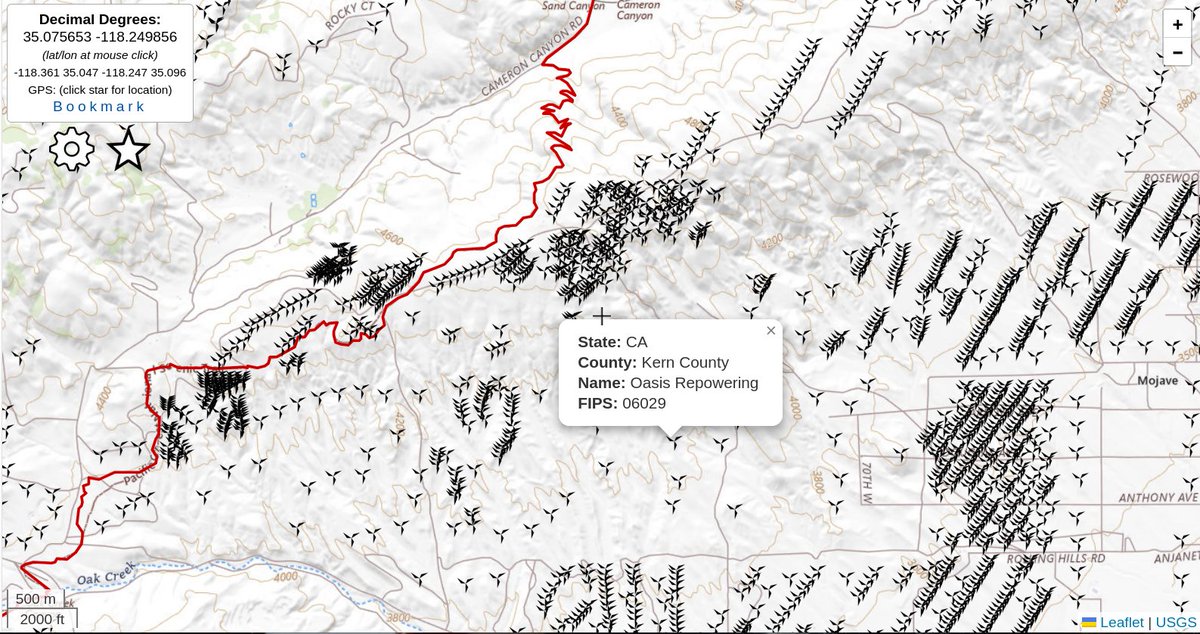
Wind turbines, the good, the bad and the ugly. postholer.com/map/Pacific-Cr… Zoomed out you get clusters of turbines, zoom in for individual turbines. Mouse over or click turbine for more info. We've added wind turbines to our data on Postholer Interactive Maps. It's surprising how

Wind turbines, the good, the bad and the ugly.

postholer.com/map/Pacific-Cr…

Zoomed out you get clusters of turbines, zoom in for individual turbines. Mouse over or click turbine for more info.

We've added wind turbines to our data on Postholer Interactive Maps. It's surprising how
Postholer - GIS Resources (@postholer) 's Twitter Profile Photo

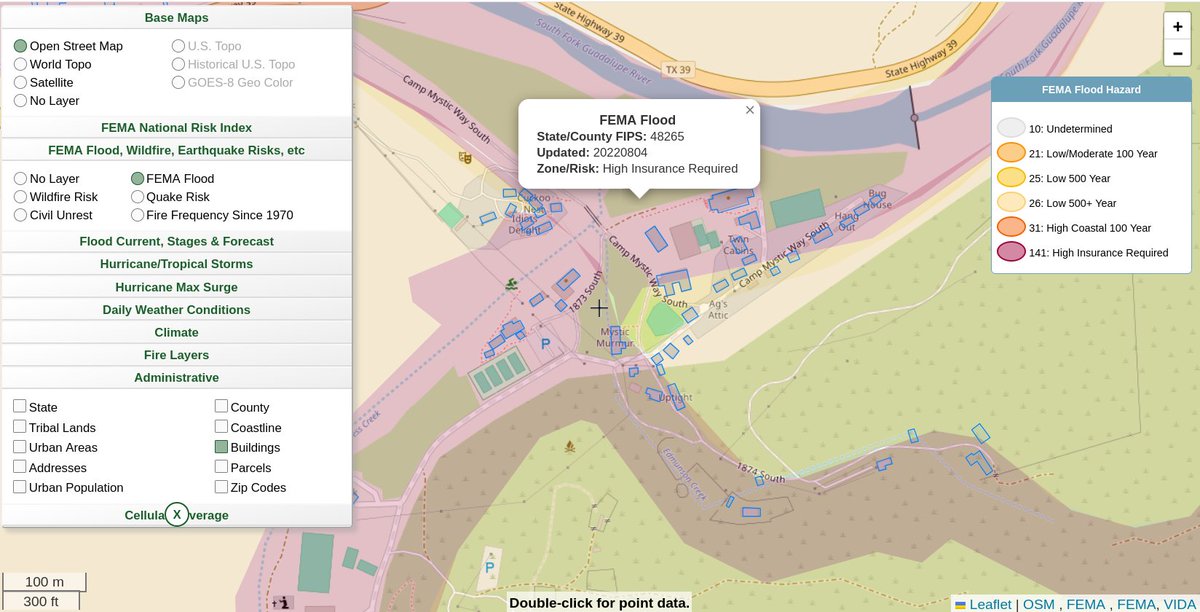
A look at #CampMystic building footprints and their placement in FEMA flood zones. #KerrCounty flood data was last revised on Aug 4, 2022. The vast majority of buildings are in a 'High, Insurance Required' zone, the highest level. femafhz.com/map/30.009188/…

A look at #CampMystic building footprints and their placement in <a href="/fema/">FEMA</a>  flood zones.  #KerrCounty flood data was last revised on Aug 4, 2022. The vast  majority of buildings are in a 'High, Insurance Required' zone, the  highest level.
femafhz.com/map/30.009188/…
Postholer - GIS Resources (@postholer) 's Twitter Profile Photo

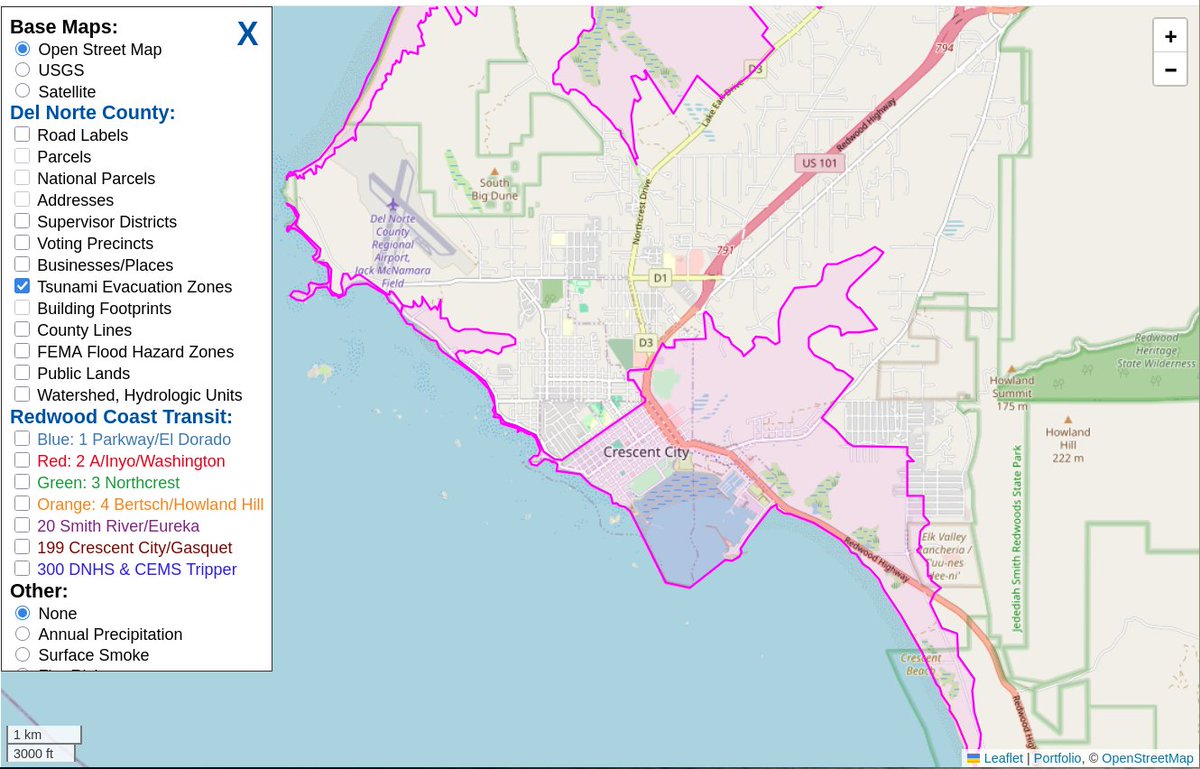
Since everyone is getting all worked up for no reason, regarding a west-coast #tsunami, for no reason I'll post an image of Crescent City, CA tsunami evac zones. This #earthquake will be a non-event. Click the 'evac zones' in the interactive map layers: delnorteresort.com

Since everyone is getting all worked up for no reason, regarding a west-coast #tsunami, for no reason I'll post an image of Crescent City, CA tsunami evac zones. This #earthquake will be a non-event. Click the 'evac zones' in the interactive map layers:
delnorteresort.com
Postholer - GIS Resources (@postholer) 's Twitter Profile Photo

Using PostGIS ST_LineInterpolatePoints to evenly get points from road features, ST_ClusterDBSCAN to get non-overlapping points for road shields on interactive map. Only ST_ClusterDBSCAN for non-overlaping GNIS place names. #30DayMapChallenge #points #postgis #leafletjs

Using PostGIS ST_LineInterpolatePoints to evenly get points from road features, ST_ClusterDBSCAN to get non-overlapping  points for road shields on interactive map.  

Only ST_ClusterDBSCAN for non-overlaping GNIS place names.   
#30DayMapChallenge #points #postgis #leafletjs
Postholer - GIS Resources (@postholer) 's Twitter Profile Photo

National Risk Index, Riverine Flooding - Expected Annual Loss Rate - National Percentile shown. Choose category by state, county or census tract #polygons. femafhz.com/map/35.137879/… #30DayMapChallenge

National Risk Index, Riverine Flooding - Expected Annual Loss Rate - National Percentile shown. Choose category by state, county or census tract #polygons.

femafhz.com/map/35.137879/…

#30DayMapChallenge
Postholer - GIS Resources (@postholer) 's Twitter Profile Photo

Comparison of NBM QPF (precipitation) forecast model vs actual QPF amounts, for 2 events, Oct 24-27 and Nov 04-06 2025 along the California north coast. Consistency is an issue. NWS Eureka National Weather Service #weather
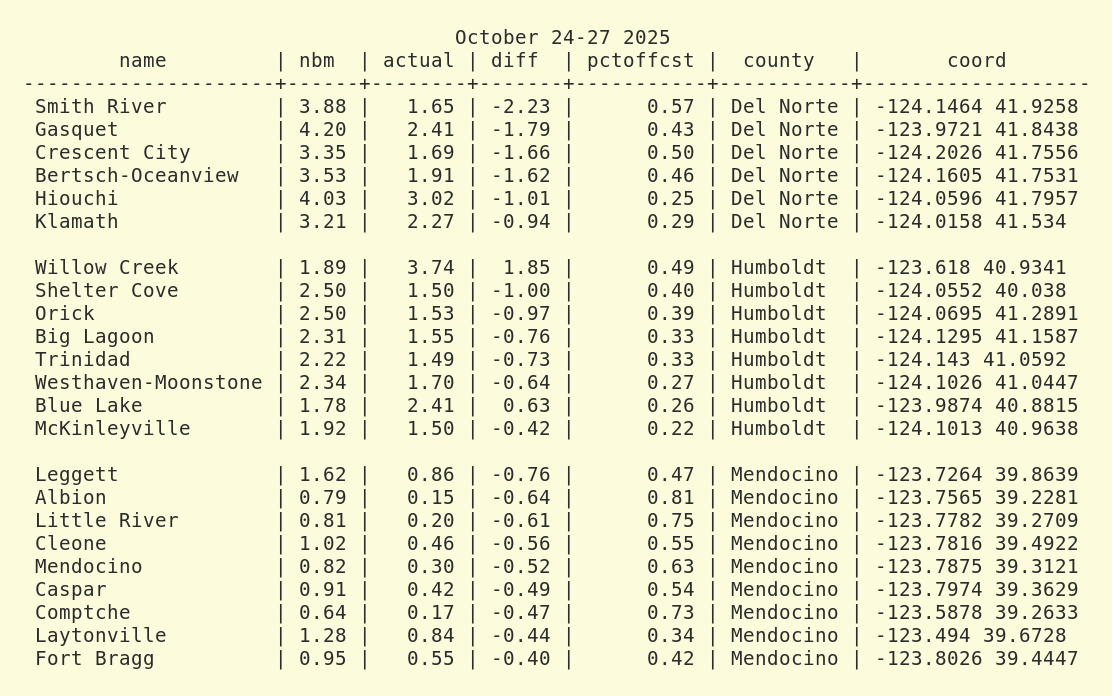
Comparison of NBM QPF (precipitation) forecast model vs actual QPF amounts, for 2 events, Oct 24-27 and Nov 04-06 2025 along the California north coast. Consistency is an issue.
<a href="/NWSEureka/">NWS Eureka</a> <a href="/NWS/">National Weather Service</a> #weather
Postholer - GIS Resources (@postholer) 's Twitter Profile Photo

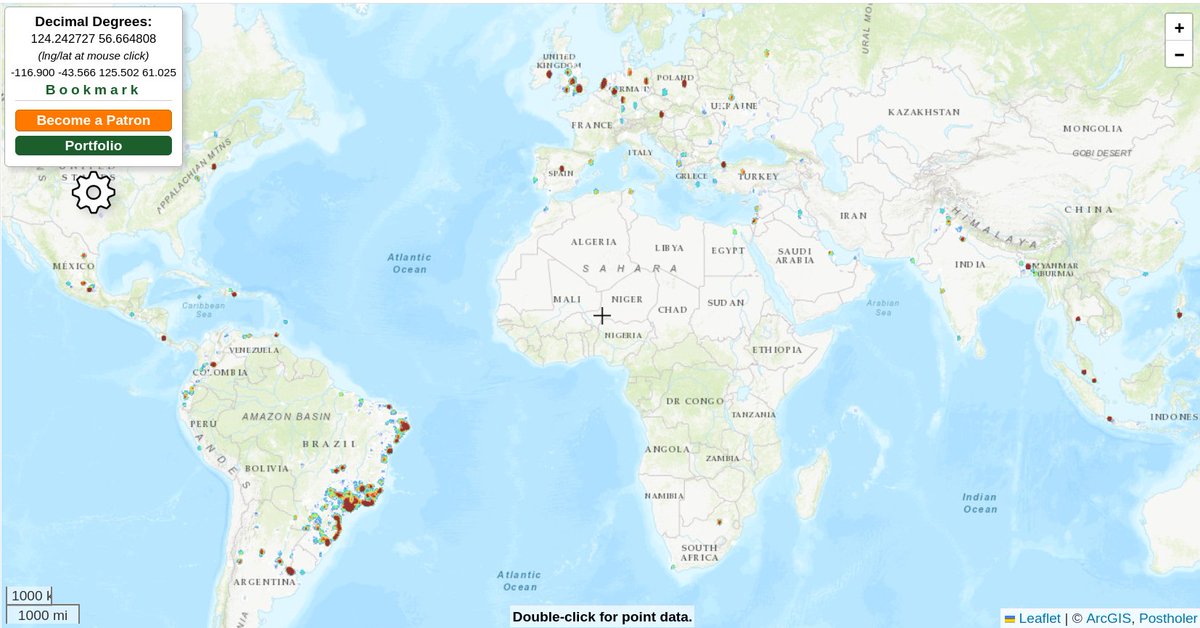
Anyone notice a massive increase of bad internet traffic coming from South America over the last few months? Here's looking at you #Brazil: femafhz.com/map/-17.951841… #gis #osint

Anyone notice a massive increase of bad internet traffic coming from South America over the last few months? 

Here's looking at you #Brazil:
femafhz.com/map/-17.951841…

#gis #osint
Postholer - GIS Resources (@postholer) 's Twitter Profile Photo

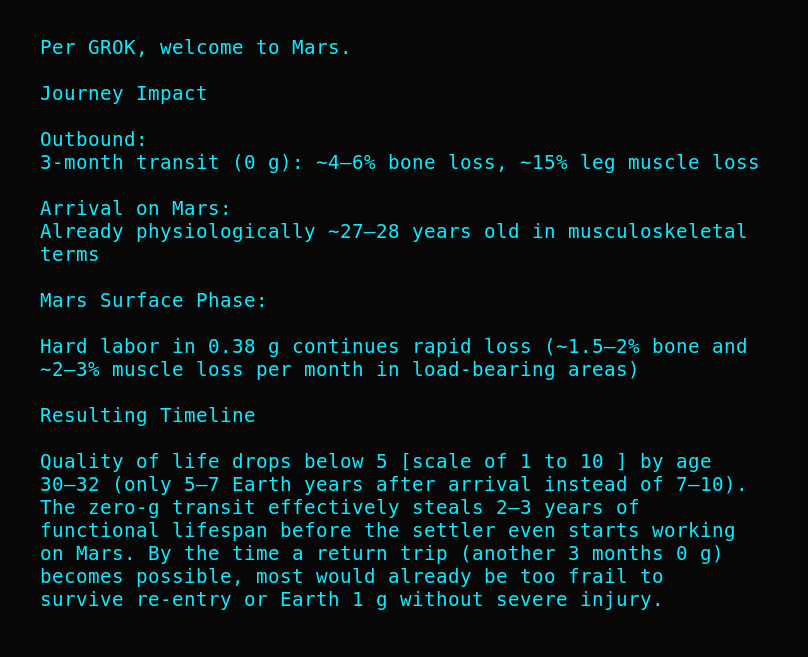
Just had a little converstation with @Grok and the reality of going to #Mars. Let's just call it what it is: a death sentence. The discussion in the image below:

Just had a little converstation with @Grok and the reality of going to #Mars. 

Let's just call it what it is: a death sentence.

The discussion in the image below: