Mind the Graph (@mindthegraph) 's Twitter Profile
Mind the Graph

@mindthegraph

The best tool to create #ScienceFigures! đź§  We help you illustrate your research easily - no design skills needed | A @cactusglobal solution | #AcademicTwitter

ID: 421187891

linkhttps://mindthegraph.com/ calendar_today25-11-2011 16:27:17

4,4K Tweet

1,1K Followers

1,1K Following

Mind the Graph (@mindthegraph) 's Twitter Profile Photo

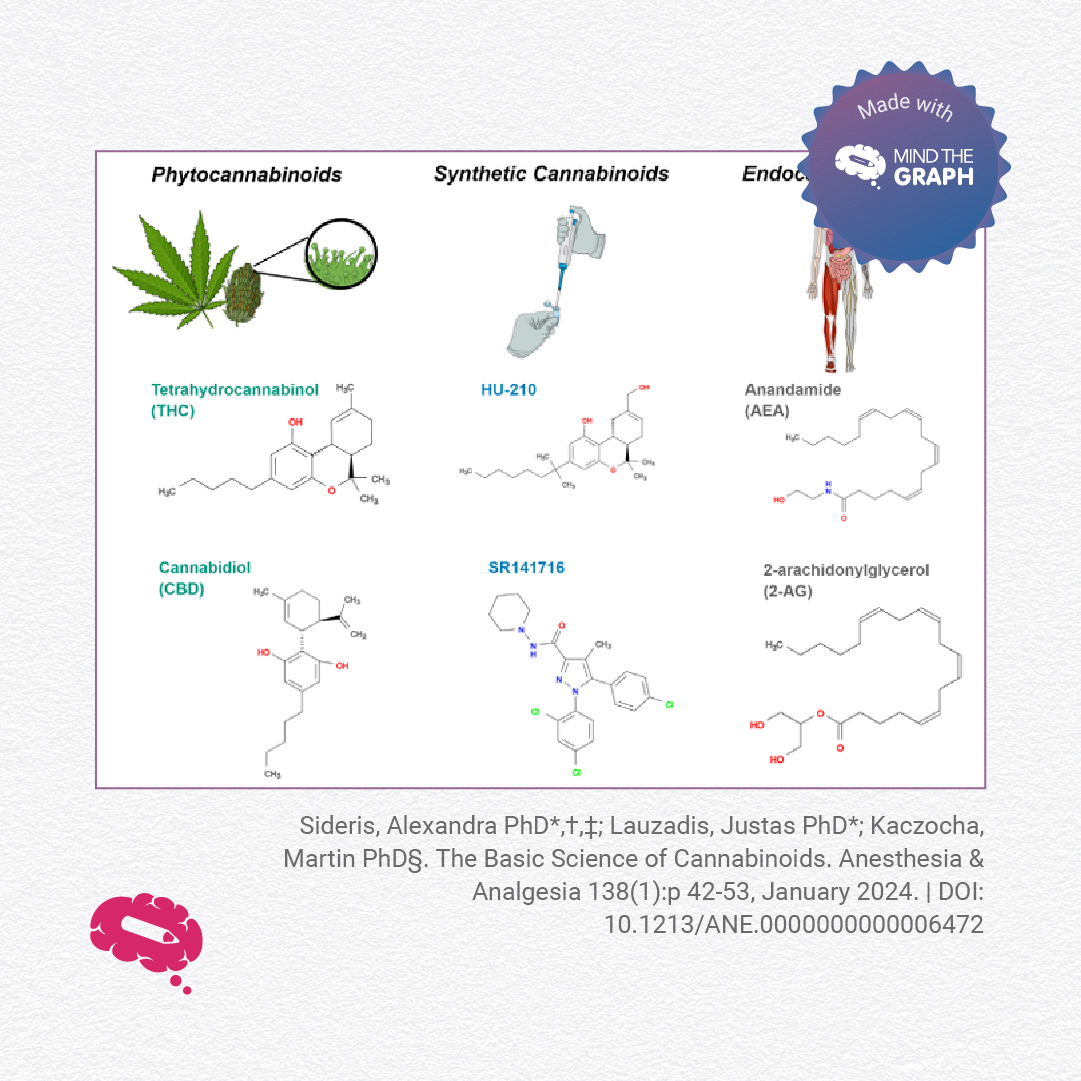
How do cannabinoids interact with the body? A study by Sideris, Lauzadis & Kaczocha in Anesthesia & Analgesia explores CB1 & CB2 receptors, neurotransmitter regulation, and cannabinoid pharmacology—all illustrated with Mind the Graph. Read more: journals.lww.com/anesthesia-ana…

How do cannabinoids interact with the body?

A study by Sideris, Lauzadis & Kaczocha in Anesthesia & Analgesia explores CB1 & CB2 receptors, neurotransmitter regulation, and cannabinoid pharmacology—all illustrated with Mind the Graph.

Read more: journals.lww.com/anesthesia-ana…
Mind the Graph (@mindthegraph) 's Twitter Profile Photo

Today is International Day of Women and Girls in Science! From past pioneers to today’s innovators, women have shaped science in extraordinary ways. Let’s celebrate their contributions! Who’s a woman in science that inspires you? Tag them!

Mind the Graph (@mindthegraph) 's Twitter Profile Photo

Great writing starts with the right words! ✍️ Want to make your essays clearer and more engaging? Learn how word choice can transform your arguments and structure. Check out our latest blog post! 🔗 mindthegraph.com/blog/words-to-…

Mind the Graph (@mindthegraph) 's Twitter Profile Photo

Science humor to fuel your day of research! 🧑‍🔬💡 @particle_science @studymeta_008 teabag.cartoon @scienceoftheuniverse

Science humor to fuel your day of research! 🧑‍🔬💡

@particle_science @studymeta_008 <a href="/teabag/">teabag</a>.cartoon @scienceoftheuniverse
Mind the Graph (@mindthegraph) 's Twitter Profile Photo

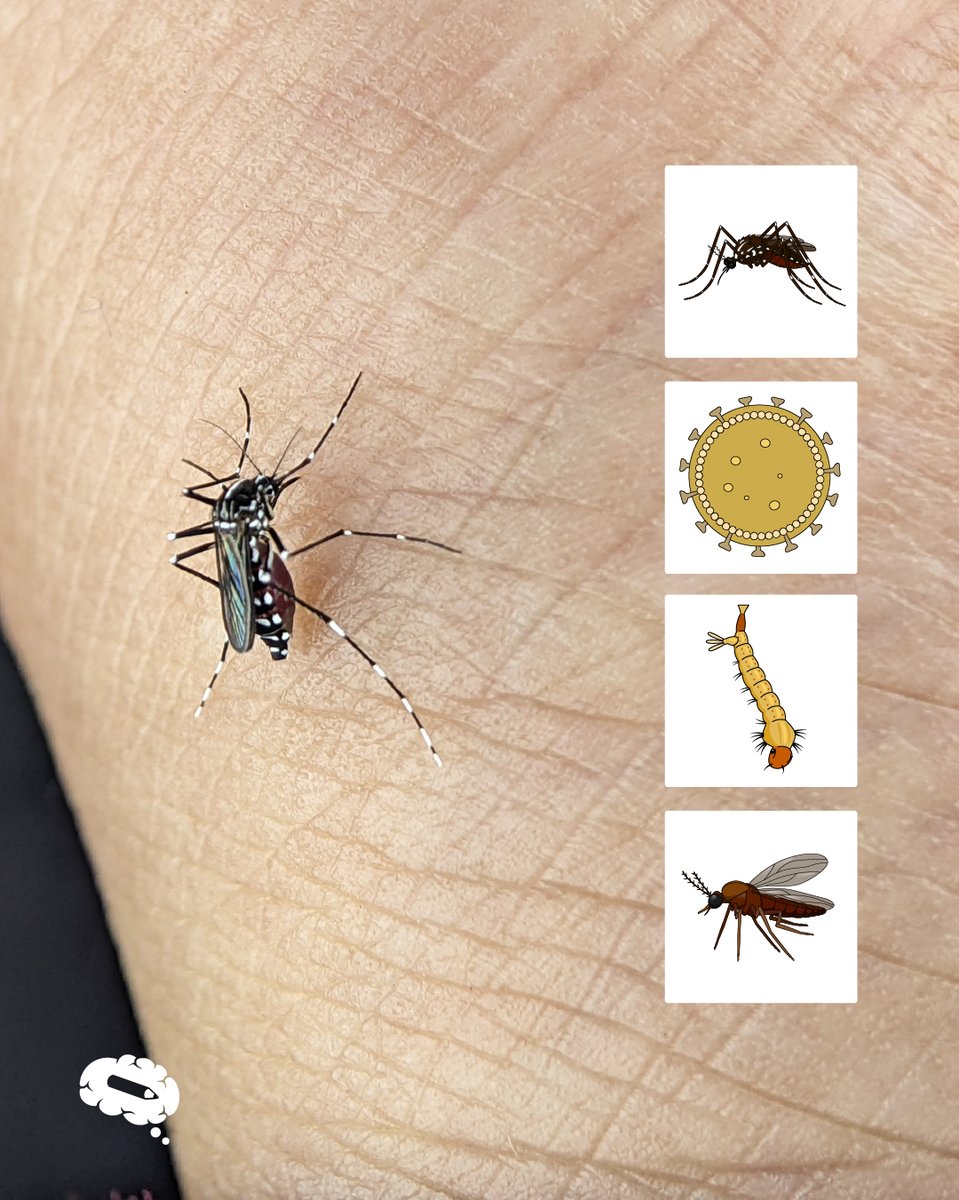
From Zika to calf development, water pollution to tomography scans, we have the scientific illustrations you need! 🌿🧬 Explore: mindthegraph.com/illustrations/

From Zika to calf development, water pollution to tomography scans, we have the scientific illustrations you need! 🌿🧬

Explore: mindthegraph.com/illustrations/
Mind the Graph (@mindthegraph) 's Twitter Profile Photo

Struggling to create engaging visuals for your research? Join us for an exclusive free webinar on “Scientific Illustrations for High-Impact Publications: Exploring Mind the Graph” with expert Sandra Bonilla! 📅Date: April 10, 2025 Register now: bit.ly/4i0PBiG

Struggling to create engaging visuals for your research? 

Join us for an exclusive free webinar on “Scientific Illustrations for High-Impact Publications: Exploring Mind the Graph” with expert Sandra Bonilla!

đź“…Date: April 10, 2025  

Register now: bit.ly/4i0PBiG
Mind the Graph (@mindthegraph) 's Twitter Profile Photo

🚨Today’s the day! 🚨 🎨 Learn the visual science secrets behind high-impact publications with Sandra Bonilla, Digital Scientific Illustration Expert & Science Communicator. 🗓️ April 10 | ⏰ 10 AM Brasilia Time Secure your spot now! Register Here: bit.ly/4j5akTM

Mind the Graph (@mindthegraph) 's Twitter Profile Photo

Transform complex ideas into clear, engaging visuals with Mind the Graph. Use exclusive scientific illustrations + easy tools to create impactful stories. Perfect for data, presentations & more. Start now → mindthegraph.com #ScienceCommunication #Infographics

Transform complex ideas into clear, engaging visuals with Mind the Graph. Use exclusive scientific illustrations + easy tools to create impactful stories. Perfect for data, presentations &amp; more. 

Start now → mindthegraph.com

#ScienceCommunication #Infographics
Mind the Graph (@mindthegraph) 's Twitter Profile Photo

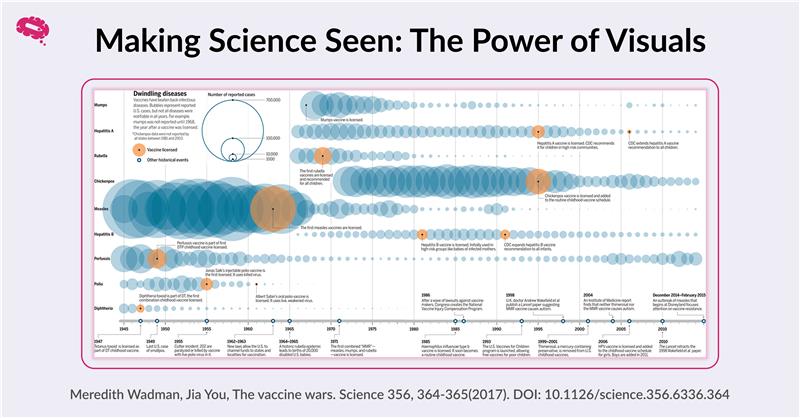
In a world flooded with opinions, clear visuals help science reach all audiences, sparking understanding and trust. Let’s make science visible and understandable for everyone, everywhere! Check it out here: mindthegraph.com #MindtheGraph #AcademicChatter #Science

In a world flooded with opinions, clear visuals help science reach all audiences, sparking understanding and trust. 
Let’s make science visible and understandable for everyone, everywhere! 

Check it out here: mindthegraph.com

#MindtheGraph #AcademicChatter #Science
Mind the Graph (@mindthegraph) 's Twitter Profile Photo

Transform Complex Science into Clear Visuals! Scientific concepts can be intricate, but the right visuals make them accessible & engaging. From infographics to data visualizations, learn how to effectively communicate your research. Read the blog here: mindthegraph.com/blog/graphics-…

Transform Complex Science into Clear Visuals!

Scientific concepts can be intricate, but the right visuals make them accessible &amp; engaging. From infographics to data visualizations, learn how to effectively communicate your research.

Read the blog here: mindthegraph.com/blog/graphics-…